Calculate the area of a figure bounded by lines.
Solution.
We find the intersection points of the given lines. To do this, we solve the system of equations:
To find the abscissa of the intersection points of given lines, we solve the equation:
We find: x 1 = -2, x 2 = 4.
So, these lines, which are a parabola and a straight line, intersect at points A(-2; 0), B(4; 6).

These lines form a closed figure, the area of which is calculated using the above formula:


Using the Newton-Leibniz formula we find:


Find the area of the region bounded by the ellipse.
Solution.

From the equation of the ellipse for the first quadrant we have. From here, using the formula, we get
Let's apply substitution x = a sin t, dx = a cos t dt. New limits of integration t = α And t = β are determined from the equations 0 = a sin t, a = a sin t. Can be put α = 0 and β = π /2.
Find one fourth of the required area
![]()
From here S = πab.
Find the area of a figure bounded by linesy = - x 2 + x + 4 andy = - x + 1.
Solution.
Let's find the points of intersection of the lines y = -x 2 + x + 4, y = -x+ 1, equating the ordinates of the lines: - x 2 + x + 4 = -x+ 1 or x 2 - 2x- 3 = 0. Finding the roots x 1 = -1, x 2 = 3 and their corresponding ordinates y 1 = 2, y 2 = -2.

Using the formula for the area of a figure, we get
Determine the area enclosed by a parabolay = x 2 + 1 and straightx + y = 3.
Solution.
Solving a system of equations
find the abscissa of the intersection points x 1 = -2 and x 2 = 1.

Believing y 2 = 3 - x And y 1 = x 2 + 1, based on the formula we get
Calculate the area contained within Bernoulli's lemniscater 2 = a 2 cos 2 φ .
Solution.

In the polar coordinate system, the area of a figure bounded by the arc of a curve r = f(φ ) and two polar radii φ 1 = ʅ And φ 2 = ʆ , will be expressed by the integral
Due to the symmetry of the curve, we first determine one-fourth of the required area
Therefore, the entire area is equal to S = a 2 .
Calculate the arc length of the astroidx 2/3 + y 2/3 = a 2/3 .
Solution.

Let us write the equation of the astroid in the form
(x 1/3) 2 + (y 1/3) 2 = (a 1/3) 2 .
Let's put x 1/3 = a 1/3 cos t, y 1/3 = a 1/3 sin t.
From here we obtain the parametric equations of the astroid
x = a cos 3 t, y = a sin 3 t, (*)
where 0 ≤ t ≤ 2π .
Due to the symmetry of the curve (*), it is enough to find one fourth of the arc length L, corresponding to the parameter change t from 0 to π /2.
We get
dx = -3a cos 2 t sin t dt, dy = 3a sin 2 t cos t dt.
From here we find
![]()
Integrating the resulting expression from 0 to π /2, we get
![]()
![]()
From here L = 6a.
Find the area enclosed by the Archimedes spiralr = aφ and two radius vectors that correspond to polar anglesφ 1 Andφ 2 (φ 1 < φ 2 ).
Solution.

Area enclosed by a curve r = f(φ ) is calculated by the formula, where α And β - limits of polar angle change.
Thus, we get

 (*)
(*)
From (*) it follows that the area limited by the polar axis and the first turn of the Archimedes spiral ( φ 1 = 0; φ 2 = 2π ):
Similarly, we find the area limited by the polar axis and the second turn of the Archimedes spiral ( φ 1 = 2π ; φ 2 = 4π ):
![]()
The required area is equal to the difference of these areas
Calculate the volume of a body obtained by rotating around an axisOx figures bounded by parabolasy = x 2 Andx = y 2 .
Solution.

Let's solve the system of equations
and we get x 1 = 0, x 2 = 1, y 1 = 0, y 2 = 1, whence the intersection points of the curves O(0; 0), B(eleven). As can be seen in the figure, the required volume of a body of revolution is equal to the difference between two volumes formed by rotation around an axis Ox curvilinear trapezoids O.C.B.A. And ODBA:

Calculate the area enclosed by an axisOx and sinusoidy = sinx on segments: a) ; b) .
Solution.

a) On a segment sin function x preserves the sign, and therefore according to the formula, assuming y= sin x, we find


b) On the segment, function sin x changes sign. To solve the problem correctly, it is necessary to divide the segment into two and [ π , 2π ], in each of which the function preserves its sign.
According to the rule of signs, on the segment [ π , 2π ] the area is taken with a minus sign.
As a result, the required area is equal to
![]()
![]()
![]()
![]()
![]()
Determine the volume of a body bounded by a surface obtained from the rotation of an ellipsearound the major axisa .
Solution.

Considering that the ellipse is symmetrical relative to the coordinate axes, it is enough to find the volume formed by rotation around the axis Ox area OAB, equal to one quarter of the area of the ellipse, and double the result.
Let us denote the volume of a body of rotation by V x; then based on the formula we have , where 0 and a- abscissas of points B And A. From the equation of the ellipse we find . From here
Thus, the required volume is equal to . (When the ellipse rotates around the minor axis b, the volume of the body is equal to )
Find the area bounded by parabolasy 2 = 2 px Andx 2 = 2 py .
Solution.

First, we find the coordinates of the points of intersection of the parabolas to determine the segment of integration. Transforming the original equations, we obtain and . Equating these values, we get or x 4 - 8p 3 x = 0.
x 4 - 8p 3 x = x(x 3 - 8p 3) = x(x - 2p)(x 2 + 2px + 4p 2) = 0.
Finding the roots of the equations:
![]()
![]()
Considering the fact that the point A intersection of parabolas is in the first quarter, then the limits of integration x= 0 and x = 2p.
We find the required area using the formula
Application of the integral to the solution of applied problems
Area calculation
The definite integral of a continuous non-negative function f(x) is numerically equal to the area of a curvilinear trapezoid bounded by the curve y = f(x), the O x axis and the straight lines x = a and x = b. In accordance with this, the area formula is written as follows:
Let's look at some examples of calculating the areas of plane figures.
Task No. 1. Calculate the area bounded by the lines y = x 2 +1, y = 0, x = 0, x = 2.
Solution. Let's construct a figure whose area we will have to calculate.
 y = x 2 + 1 is a parabola whose branches are directed upward, and the parabola is shifted upward by one unit relative to the O y axis (Figure 1).
Figure 1. Graph of the function y = x 2 + 1
Task No. 2. Calculate the area bounded by the lines y = x 2 – 1, y = 0 in the range from 0 to 1.
 |
Solution. The graph of this function is a parabola of branches that are directed upward, and the parabola is shifted relative to the O y axis downward by one unit (Figure 2).
Figure 2. Graph of the function y = x 2 – 1
Task No. 3. Make a drawing and calculate the area of the figure bounded by the lines
y = 8 + 2x – x 2 and y = 2x – 4.
Solution. The first of these two lines is a parabola with its branches directed downward, since the coefficient of x 2 is negative, and the second line is a straight line intersecting both coordinate axes.
To construct a parabola, we find the coordinates of its vertex: y’=2 – 2x; 2 – 2x = 0, x = 1 – abscissa of the vertex; y(1) = 8 + 2∙1 – 1 2 = 9 is its ordinate, N(1;9) is the vertex.
Now let’s find the intersection points of the parabola and the straight line by solving the system of equations:

Equating the right sides of an equation whose left sides are equal.
We get 8 + 2x – x 2 = 2x – 4 or x 2 – 12 = 0, whence ![]() .
.
So, the points are the intersection points of a parabola and a straight line (Figure 1).


Figure 3 Graphs of functions y = 8 + 2x – x 2 and y = 2x – 4
Let's construct a straight line y = 2x – 4. It passes through the points (0;-4), (2;0) on the coordinate axes.
To construct a parabola, you can also use its intersection points with the 0x axis, that is, the roots of the equation 8 + 2x – x 2 = 0 or x 2 – 2x – 8 = 0. Using Vieta’s theorem, it is easy to find its roots: x 1 = 2, x 2 = 4.
Figure 3 shows a figure (parabolic segment M 1 N M 2) bounded by these lines.
The second part of the problem is to find the area of this figure. Its area can be found using a definite integral according to the formula  .
.
Applied to this condition, we get the integral: 
2 Calculation of the volume of a body of rotation
The volume of the body obtained from the rotation of the curve y = f(x) around the O x axis is calculated by the formula:
When rotating around the O y axis, the formula looks like:
Task No. 4. Determine the volume of the body obtained from the rotation of a curved trapezoid bounded by straight lines x = 0 x = 3 and curve y = around the O x axis.
Solution. Let's draw a picture (Figure 4).

Figure 4. Graph of the function y =
The required volume is 
Task No. 5. Calculate the volume of the body obtained from the rotation of a curved trapezoid bounded by the curve y = x 2 and straight lines y = 0 and y = 4 around the O y axis.
Solution. We have:

Review questions
Enter the function for which you need to find the integral
The calculator provides DETAILED solutions to definite integrals.
This calculator finds a solution to the definite integral of the function f(x) with given upper and lower limits.
Examples
Using degree
(square and cube) and fractions
(x^2 - 1)/(x^3 + 1)
Square root
Sqrt(x)/(x + 1)
Cube root
Cbrt(x)/(3*x + 2)
Using sine and cosine
2*sin(x)*cos(x)
arcsine
X*arcsin(x)
arc cosine
X*arccos(x)
Application of logarithm
X*log(x, 10)
Exhibitor
Tg(x)*sin(x)
Cotangent
Ctg(x)*cos(x)
Irrational fractions
(sqrt(x) - 1)/sqrt(x^2 - x - 1)
Arctangent
X*arctg(x)
Arccotangent
X*arсctg(x)
Hyperbolic sine and cosine
2*sh(x)*ch(x)
Hyperbolic tangent and cotangent
Ctgh(x)/tgh(x)
Hyperbolic arcsine and arccosine
X^2*arcsinh(x)*arccosh(x)
Hyberbolic arctangent and arccotangent
X^2*arctgh(x)*arcctgh(x)
Rules for entering expressions and functions
Expressions can consist of functions (notations are given in alphabetical order): absolute(x) Absolute value x
(module x or |x|)
arccos(x) Function - arc cosine of x arccosh(x) Arc cosine hyperbolic from x arcsin(x) Arcsine from x arcsinh(x) Arcsine hyperbolic from x arctan(x) Function - arctangent of x arctgh(x) Arctangent hyperbolic from x e e a number that is approximately equal to 2.7 exp(x) Function - exponent of x(as e^x)
log(x) or ln(x) Natural logarithm of x
(To obtain log7(x), you need to enter log(x)/log(7) (or, for example, for log10(x)=log(x)/log(10)) pi The number is "Pi", which is approximately equal to 3.14 sin(x) Function - Sine of x cos(x) Function - Cosine of x sinh(x) Function - Sine hyperbolic from x cosh(x) Function - Cosine hyperbolic from x sqrt(x) Function - Square root from x sqr(x) or x^2 Function - Square x tan(x) Function - Tangent from x tgh(x) Function - Tangent hyperbolic from x cbrt(x) Function - cube root of x
The following operations can be used in expressions: Real numbers
enter as 7.5
, Not 7,5
2*x- multiplication 3/x- division x^3- exponentiation x+7- addition x - 6- subtraction
Other features: floor(x) Function - rounding x downward (example floor(4.5)==4.0) ceiling(x) Function - rounding x upward (example ceiling(4.5)==5.0) sign(x) Function - Sign x erf(x) Error function (or probability integral) laplace(x) Laplace function
A)
Solution.
The first and most important point of the decision is the construction of the drawing.
Let's make the drawing:
The equation y=0 sets the “x” axis;
- x=-2 And x=1 - straight, parallel to the axis OU;
- y=x 2 +2 - a parabola, the branches of which are directed upward, with the vertex at the point (0;2).
Comment. To construct a parabola, it is enough to find the points of its intersection with coordinate axes, i.e. putting x=0 find the intersection with the axis OU and deciding accordingly quadratic equation, find the intersection with the axis Oh .
The vertex of a parabola can be found using the formulas:
You can also build lines point by point.
On the interval [-2;1] the graph of the function y=x 2 +2 located above the axis Ox , That's why:
Answer: S =9 sq. units
After the task is completed, it is always useful to look at the drawing and figure out whether the answer is real. In this case, “by eye” we count the number of cells in the drawing - well, there will be about 9, it seems to be true. It is completely clear that if we got, say, the answer: 20 square units, then it is obvious that a mistake was made somewhere - 20 cells clearly do not fit into the figure in question, at most a dozen. If the answer is negative, then the task was also solved incorrectly.
What to do if the curved trapezoid is located under the axle Oh?
b) Calculate the area of a figure bounded by lines y=-e x , x=1 and coordinate axes.
Solution.
Let's make a drawing.
If a curved trapezoid completely located under the axis Oh , then its area can be found using the formula:
Answer: S=(e-1) sq. units" 1.72 sq. units
Attention! The two types of tasks should not be confused:
1) If you are asked to solve simply a definite integral without any geometric meaning, then it can be negative.
2) If you are asked to find the area of a figure using a definite integral, then the area is always positive! That is why the minus appears in the formula just discussed.
In practice, most often the figure is located in both the upper and lower half-plane.
With) Find the area of a plane figure bounded by lines y=2x-x 2, y=-x.
Solution.
First you need to complete the drawing. Generally speaking, when constructing a drawing in area problems, we are most interested in the points of intersection of lines. Let's find the intersection points of the parabola and the line. This can be done in two ways. The first method is analytical.
We solve the equation:
This means that the lower limit of integration a=0 , upper limit of integration b=3 .
|
We build the given lines: 1. Parabola - vertex at point (1;1); axis intersection Oh - points (0;0) and (0;2). 2. Straight line - bisector of the 2nd and 4th coordinate angles. And now Attention! If on the segment [ a;b] some continuous function f(x) greater than or equal to some continuous function g(x), then the area of the corresponding figure can be found using the formula: . And it doesn’t matter where the figure is located - above the axis or below the axis, but what matters is which graph is HIGHER (relative to another graph), and which is BELOW. In the example under consideration, it is obvious that on the segment the parabola is located above the straight line, and therefore it is necessary to subtract from |
You can construct lines point by point, and the limits of integration become clear “by themselves.” Nevertheless, the analytical method of finding limits still sometimes has to be used if, for example, the graph is large enough, or the detailed construction did not reveal the limits of integration (they can be fractional or irrational).
The desired figure is limited by a parabola above and a straight line below.
On the segment, according to the corresponding formula:
Answer: S =4.5 sq. units
In the previous section, devoted to the analysis of the geometric meaning of a definite integral, we received a number of formulas for calculating the area of a curvilinear trapezoid:
S (G) = ∫ a b f (x) d x for a continuous and non-negative function y = f (x) on the interval [ a ; b ] ,
S (G) = - ∫ a b f (x) d x for a continuous and non-positive function y = f (x) on the interval [ a ; b ] .
These formulas are applicable to solve for simple tasks. In reality, we will often have to work with more complex figures. In this regard, we will devote this section to an analysis of algorithms for calculating the area of figures that are limited by functions in explicit form, i.e. like y = f(x) or x = g(y).
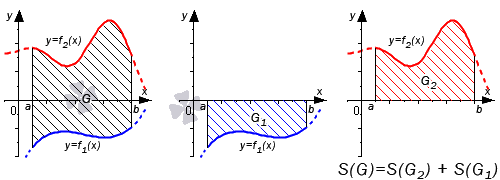
TheoremLet the functions y = f 1 (x) and y = f 2 (x) be defined and continuous on the interval [ a ; b ] , and f 1 (x) ≤ f 2 (x) for any value x from [ a ; b ] . Then the formula for calculating the area of the figure G, bounded by the lines x = a, x = b, y = f 1 (x) and y = f 2 (x) will look like S (G) = ∫ a b f 2 (x) - f 1 (x) d x .
A similar formula will be applicable for the area of a figure bounded by the lines y = c, y = d, x = g 1 (y) and x = g 2 (y): S (G) = ∫ c d (g 2 (y) - g 1 (y) d y .
Proof
Let's look at three cases for which the formula will be valid.
In the first case, taking into account the property of additivity of area, the sum of the areas of the original figure G and the curvilinear trapezoid G1 is equal to the area of the figure G2. It means that

Therefore, S (G) = S (G 2) - S (G 1) = ∫ a b f 2 (x) d x - ∫ a b f 1 (x) d x = ∫ a b (f 2 (x) - f 1 (x)) dx.
We can perform the last transition using the third property of the definite integral.
In the second case, the equality is true: S (G) = S (G 2) + S (G 1) = ∫ a b f 2 (x) d x + - ∫ a b f 1 (x) d x = ∫ a b (f 2 (x) - f 1 (x)) d x
The graphic illustration will look like:
If both functions are non-positive, we get: S (G) = S (G 2) - S (G 1) = - ∫ a b f 2 (x) d x - - ∫ a b f 1 (x) d x = ∫ a b (f 2 (x) - f 1 (x)) d x . The graphic illustration will look like:

Let's move on to consider the general case when y = f 1 (x) and y = f 2 (x) intersect the O x axis.
We denote the intersection points as x i, i = 1, 2, . . . , n - 1 . These points split the segment [a; b ] into n parts x i - 1 ; x i, i = 1, 2, . . . , n, where α = x 0< x 1 < x 2 < . . . < x n - 1 < x n = b . Фигуру G можно представить объединением фигур G i , i = 1 , 2 , . . . , n . Очевидно, что на своем интервале G i попадает под один из трех рассмотренных ранее случаев, поэтому их площади находятся как S (G i) = ∫ x i - 1 x i (f 2 (x) - f 1 (x)) d x , i = 1 , 2 , . . . , n
Hence,
S (G) = ∑ i = 1 n S (G i) = ∑ i = 1 n ∫ x i x i f 2 (x) - f 1 (x)) d x = = ∫ x 0 x n (f 2 (x) - f ( x)) d x = ∫ a b f 2 (x) - f 1 (x) d x
We can make the last transition using the fifth property of the definite integral.
Let us illustrate the general case on the graph.

The formula S (G) = ∫ a b f 2 (x) - f 1 (x) d x can be considered proven.
Now let’s move on to analyzing examples of calculating the area of figures that are limited by the lines y = f (x) and x = g (y).
We will begin our consideration of any of the examples by constructing a graph. The image will allow us to represent complex shapes as unions of simpler shapes. If constructing graphs and figures on them causes you difficulties, you can study the section on basic elementary functions, geometric transformation of graphs of functions, and also constructing graphs while studying a function.
Example 1
It is necessary to determine the area of the figure, which is limited by the parabola y = - x 2 + 6 x - 5 and straight lines y = - 1 3 x - 1 2, x = 1, x = 4.
Solution
Let's draw the lines on the graph in the Cartesian coordinate system.

On the segment [ 1 ; 4 ] the graph of the parabola y = - x 2 + 6 x - 5 is located above the straight line y = - 1 3 x - 1 2. In this regard, to obtain the answer we use the formula obtained earlier, as well as the method of calculating the definite integral using the Newton-Leibniz formula:
S (G) = ∫ 1 4 - x 2 + 6 x - 5 - - 1 3 x - 1 2 d x = = ∫ 1 4 - x 2 + 19 3 x - 9 2 d x = - 1 3 x 3 + 19 6 x 2 - 9 2 x 1 4 = = - 1 3 4 3 + 19 6 4 2 - 9 2 4 - - 1 3 1 3 + 19 6 1 2 - 9 2 1 = = - 64 3 + 152 3 - 18 + 1 3 - 19 6 + 9 2 = 13
Answer: S(G) = 13
Let's look at a more complex example.
Example 2
It is necessary to calculate the area of the figure, which is limited by the lines y = x + 2, y = x, x = 7.
Solution
In this case, we have only one straight line located parallel to the x-axis. This is x = 7. This requires us to find the second limit of integration ourselves.
Let's build a graph and plot on it the lines given in the problem statement.

Having the graph in front of our eyes, we can easily determine that the lower limit of integration will be the abscissa of the point of intersection of the graph of the straight line y = x and the semi-parabola y = x + 2. To find the abscissa we use the equalities:
y = x + 2 O DZ: x ≥ - 2 x 2 = x + 2 2 x 2 - x - 2 = 0 D = (- 1) 2 - 4 1 (- 2) = 9 x 1 = 1 + 9 2 = 2 ∈ O DZ x 2 = 1 - 9 2 = - 1 ∉ O DZ
It turns out that the abscissa of the intersection point is x = 2.
We draw your attention to the fact that in general example in the drawing the lines y = x + 2, y = x intersect at the point (2; 2), therefore such detailed calculations may seem unnecessary. We brought this here detailed solution only because there are more difficult cases the solution may not be so obvious. This means that it is always better to calculate the coordinates of the intersection of lines analytically.
On the interval [ 2 ; 7] the graph of the function y = x is located above the graph of the function y = x + 2. Let's apply the formula to calculate the area:
S (G) = ∫ 2 7 (x - x + 2) d x = x 2 2 - 2 3 · (x + 2) 3 2 2 7 = = 7 2 2 - 2 3 · (7 + 2) 3 2 - 2 2 2 - 2 3 2 + 2 3 2 = = 49 2 - 18 - 2 + 16 3 = 59 6
Answer: S (G) = 59 6
Example 3
It is necessary to calculate the area of the figure, which is limited by the graphs of the functions y = 1 x and y = - x 2 + 4 x - 2.
Solution
Let's plot the lines on the graph.
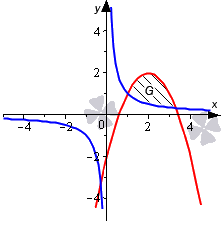
Let's define the limits of integration. To do this, we determine the coordinates of the points of intersection of the lines by equating the expressions 1 x and - x 2 + 4 x - 2. Provided that x is not zero, the equality 1 x = - x 2 + 4 x - 2 becomes equivalent to the third degree equation - x 3 + 4 x 2 - 2 x - 1 = 0 with integer coefficients. To refresh your memory of the algorithm for solving such equations, we can refer to the section “Solving cubic equations.”
The root of this equation is x = 1: - 1 3 + 4 1 2 - 2 1 - 1 = 0.
Dividing the expression - x 3 + 4 x 2 - 2 x - 1 by the binomial x - 1, we get: - x 3 + 4 x 2 - 2 x - 1 ⇔ - (x - 1) (x 2 - 3 x - 1) = 0
We can find the remaining roots from the equation x 2 - 3 x - 1 = 0:
x 2 - 3 x - 1 = 0 D = (- 3) 2 - 4 · 1 · (- 1) = 13 x 1 = 3 + 13 2 ≈ 3 . 3; x 2 = 3 - 13 2 ≈ - 0 . 3
We found the interval x ∈ 1; 3 + 13 2, in which the figure G is contained above the blue and below the red line. This helps us determine the area of the figure:
S (G) = ∫ 1 3 + 13 2 - x 2 + 4 x - 2 - 1 x d x = - x 3 3 + 2 x 2 - 2 x - ln x 1 3 + 13 2 = = - 3 + 13 2 3 3 + 2 3 + 13 2 2 - 2 3 + 13 2 - ln 3 + 13 2 - - - 1 3 3 + 2 1 2 - 2 1 - ln 1 = 7 + 13 3 - ln 3 + 13 2
Answer: S (G) = 7 + 13 3 - ln 3 + 13 2
Example 4
It is necessary to calculate the area of the figure, which is limited by the curves y = x 3, y = - log 2 x + 1 and the abscissa axis.
Solution
Let's plot all the lines on the graph. We can get the graph of the function y = - log 2 x + 1 from the graph y = log 2 x if we position it symmetrically about the x-axis and move it up one unit. The equation of the x-axis is y = 0.

Let us mark the points of intersection of the lines.
As can be seen from the figure, the graphs of the functions y = x 3 and y = 0 intersect at the point (0; 0). This happens because x = 0 is the only real root of the equation x 3 = 0.
x = 2 is the only root of the equation - log 2 x + 1 = 0, so the graphs of the functions y = - log 2 x + 1 and y = 0 intersect at the point (2; 0).
x = 1 is the only root of the equation x 3 = - log 2 x + 1 . In this regard, the graphs of the functions y = x 3 and y = - log 2 x + 1 intersect at the point (1; 1). The last statement may not be obvious, but the equation x 3 = - log 2 x + 1 cannot have more than one root, since the function y = x 3 is strictly increasing, and the function y = - log 2 x + 1 is strictly decreasing.
The further solution involves several options.
Option #1
We can imagine figure G as the sum of two curvilinear trapezoids located above the x-axis, the first of which is located below midline on the segment x ∈ 0; 1, and the second is below the red line on the segment x ∈ 1; 2. This means that the area will be equal to S (G) = ∫ 0 1 x 3 d x + ∫ 1 2 (- log 2 x + 1) d x .
Option No. 2
Figure G can be represented as the difference of two figures, the first of which is located above the x-axis and below the blue line on the segment x ∈ 0; 2, and the second between the red and blue lines on the segment x ∈ 1; 2. This allows us to find the area as follows:
S (G) = ∫ 0 2 x 3 d x - ∫ 1 2 x 3 - (- log 2 x + 1) d x
In this case, to find the area you will have to use a formula of the form S (G) = ∫ c d (g 2 (y) - g 1 (y)) d y. In fact, the lines that bound the figure can be represented as functions of the argument y.
Let's solve the equations y = x 3 and - log 2 x + 1 with respect to x:
y = x 3 ⇒ x = y 3 y = - log 2 x + 1 ⇒ log 2 x = 1 - y ⇒ x = 2 1 - y
We get the required area:
S (G) = ∫ 0 1 (2 1 - y - y 3) d y = - 2 1 - y ln 2 - y 4 4 0 1 = = - 2 1 - 1 ln 2 - 1 4 4 - - 2 1 - 0 ln 2 - 0 4 4 = - 1 ln 2 - 1 4 + 2 ln 2 = 1 ln 2 - 1 4
Answer: S (G) = 1 ln 2 - 1 4
Example 5
It is necessary to calculate the area of the figure, which is limited by the lines y = x, y = 2 3 x - 3, y = - 1 2 x + 4.
Solution
We will draw a line on the graph with a red line, given by the function y = x. We draw the line y = - 1 2 x + 4 in blue, and the line y = 2 3 x - 3 in black.

Let's mark the intersection points.
Let's find the intersection points of the graphs of the functions y = x and y = - 1 2 x + 4:
x = - 1 2 x + 4 O DZ: x ≥ 0 x = - 1 2 x + 4 2 ⇒ x = 1 4 x 2 - 4 x + 16 ⇔ x 2 - 20 x + 64 = 0 D = (- 20) 2 - 4 1 64 = 144 x 1 = 20 + 144 2 = 16 ; x 2 = 20 - 144 2 = 4 Check: x 1 = 16 = 4, - 1 2 x 1 + 4 = - 1 2 16 + 4 = - 4 ⇒ x 1 = 16 not Is the solution to the equation x 2 = 4 = 2, - 1 2 x 2 + 4 = - 1 2 4 + 4 = 2 ⇒ x 2 = 4 is the solution to the equation ⇒ (4; 2) point of intersection i y = x and y = - 1 2 x + 4
Let's find the intersection point of the graphs of the functions y = x and y = 2 3 x - 3:
x = 2 3 x - 3 O DZ: x ≥ 0 x = 2 3 x - 3 2 ⇔ x = 4 9 x 2 - 4 x + 9 ⇔ 4 x 2 - 45 x + 81 = 0 D = (- 45 ) 2 - 4 4 81 = 729 x 1 = 45 + 729 8 = 9, x 2 45 - 729 8 = 9 4 Check: x 1 = 9 = 3, 2 3 x 1 - 3 = 2 3 9 - 3 = 3 ⇒ x 1 = 9 is the solution to the equation ⇒ (9 ; 3) point a s y = x and y = 2 3 x - 3 x 2 = 9 4 = 3 2, 2 3 x 1 - 3 = 2 3 9 4 - 3 = - 3 2 ⇒ x 2 = 9 4 There is no solution to the equation
Let's find the point of intersection of the lines y = - 1 2 x + 4 and y = 2 3 x - 3:
1 2 x + 4 = 2 3 x - 3 ⇔ - 3 x + 24 = 4 x - 18 ⇔ 7 x = 42 ⇔ x = 6 - 1 2 6 + 4 = 2 3 6 - 3 = 1 ⇒ (6 ; 1) point of intersection y = - 1 2 x + 4 and y = 2 3 x - 3
Method No. 1
Let us imagine the area of the desired figure as the sum of the areas of individual figures.

Then the area of the figure is:
S (G) = ∫ 4 6 x - - 1 2 x + 4 d x + ∫ 6 9 x - 2 3 x - 3 d x = = 2 3 x 3 2 + x 2 4 - 4 x 4 6 + 2 3 x 3 2 - x 2 3 + 3 x 6 9 = = 2 3 6 3 2 + 6 2 4 - 4 6 - 2 3 4 3 2 + 4 2 4 - 4 4 + + 2 3 9 3 2 - 9 2 3 + 3 9 - 2 3 6 3 2 - 6 2 3 + 3 6 = = - 25 3 + 4 6 + - 4 6 + 12 = 11 3
Method No. 2
The area of the original figure can be represented as the sum of two other figures.

Then we solve the equation of the line relative to x, and only after that we apply the formula for calculating the area of the figure.
y = x ⇒ x = y 2 red line y = 2 3 x - 3 ⇒ x = 3 2 y + 9 2 black line y = - 1 2 x + 4 ⇒ x = - 2 y + 8 s i n i a l i n e
So the area is:
S (G) = ∫ 1 2 3 2 y + 9 2 - - 2 y + 8 d y + ∫ 2 3 3 2 y + 9 2 - y 2 d y = = ∫ 1 2 7 2 y - 7 2 d y + ∫ 2 3 3 2 y + 9 2 - y 2 d y = = 7 4 y 2 - 7 4 y 1 2 + - y 3 3 + 3 y 2 4 + 9 2 y 2 3 = 7 4 2 2 - 7 4 2 - 7 4 1 2 - 7 4 1 + + - 3 3 3 + 3 3 2 4 + 9 2 3 - - 2 3 3 + 3 2 2 4 + 9 2 2 = = 7 4 + 23 12 = 11 3
As you can see, the values are the same.
Answer: S (G) = 11 3
Results
To find the area of a figure that is limited given lines we need to construct lines on the plane, find their intersection points, and apply the formula to find the area. In this section, we examined the most common variants of tasks.
If you notice an error in the text, please highlight it and press Ctrl+Enter