To identify proteins, various search systems are used in the EMBL and Sequest databases, developed within research teams. However, the Mascot search engine has become the standard for protein identification. Like almost all search engines, it uses a web interface and the search engine itself is available on the Internet, but it can also be purchased and installed on the user’s computer.
Mascot can work with a variety of pluggable protein and genomic databases. These can be extensive public databases, such as NCBI or SwissProt, commercial, or created by the user himself.
In all systems, identification is carried out using mass spectrometric data obtained by the researcher, by comparing them with known protein structures.
Considering that in recent decades, sequencing of proteins has essentially been reduced to sequencing the genes encoding them, in practice it makes more sense to identify proteins by comparing experimental mass spectrometric data with known genomes.
There are various protein identification algorithms, but their capabilities are limited by currently known genomes. Although, given that organisms of different species still have homologous proteins, it is often possible to identify proteins from organisms with an unknown genome.
Different methodological approaches to proteomic research provide fundamentally different types of data and require their own computational approaches for processing.
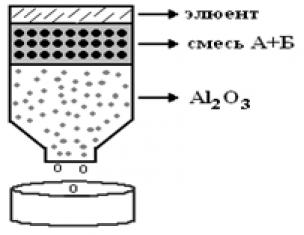
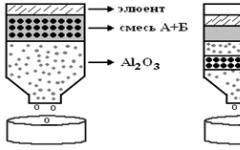
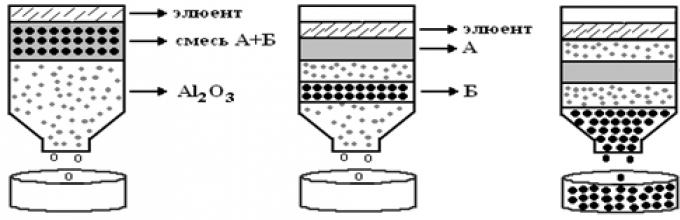
The most accessible and high-performance method is the identification of specific proteolytic hydrolysis using mass spectrometric peptide maps. In the English literature it is known as Peptide Mass Fingerprint (PMF). Trypsin is most often used as a specific protease. At the first stage, the protein isolated (for example, by electrophoresis) undergoes proteolytic hydrolysis. As a result of this hydrolysis, a mixture of peptides is obtained. Given that a highly specific protease is used, this will be a mixture of very specific peptides. So, when using trypsin, the protein will be “cut” into arginine and lysine.
The next stage is recording the mass spectrum of the resulting mixture. The result is a set or list of molecular weights. It does not provide any information about the structure or other properties of the products; the method is based only on the assumption that these are the molecular weights of the peptides, and these peptides were formed as a result of specific hydrolysis. This is where the main idea of the approach is hidden - if each protein has its own set of peptides and a corresponding list of molecular masses, then it is quite possible to solve the inverse problem - to find the corresponding protein for the resulting list of molecular masses. And such a problem can indeed often be solved.
In particular, this allows you to create a mascot.
GOST R 53761-2009
Group H19
NATIONAL STANDARD OF THE RUSSIAN FEDERATION
MILK
Identification of protein composition by electrophoretic method in polyacrylamide gel
Milk. Identification of protein composition by use of electrophoresis in polyacrylamide gel
OKS 67.100.10
OKSTU 9209
Date of introduction 2011-01-01
Preface
The goals and principles of standardization in the Russian Federation are established by Federal Law of December 27, 2002 N 184-FZ "On Technical Regulation", and the rules for applying national standards of the Russian Federation are GOST R 1.0-2004 "Standardization in the Russian Federation. Basic Provisions"
Standard information
1 DEVELOPED by the State Institution of the Yaroslavl Region "Yaroslavl State Institute of Quality of Raw Materials and Food Products" (GU YAO "YAGIKSPP")
2 INTRODUCED by the Technical Committee for Standardization TC 470 "Milk and milk processing products"
3 APPROVED AND ENTERED into force by Order of the Federal Agency for Technical Regulation and Metrology dated December 15, 2009 N 1271-st
4 INTRODUCED FOR THE FIRST TIME
Information about changes to this standard is published in the annually published information index "National Standards", and the text of changes and amendments is published in the monthly published information index "National Standards". In case of revision (replacement) or cancellation of this standard, the corresponding notice will be published in the monthly published information index "National Standards". Relevant information, notifications and texts are also posted in the public information system - on the official website of the Federal Agency for Technical Regulation and Metrology on the Internet
1 Application area
1 Application area
This standard applies to raw milk and specifies a method for identifying milk and non-dairy proteins in raw milk using polyacrylamide gel electrophoresis.
2 Normative references
This standard uses normative references to the following standards:
GOST R 51652-2000 Rectified ethyl alcohol from food raw materials. Specifications
GOST R 52054-2003 Raw cow's milk. Specifications
GOST R 52349-2005 Food products. Functional food products. Terms and definitions
GOST R 52738-2007 Milk and milk processing products. Terms and definitions
GOST 12.1.004-91 System of occupational safety standards. Fire safety. General requirements
GOST 12.1.005-88 System of occupational safety standards. General sanitary and hygienic requirements for the air of the working area
GOST 12.1.007-76 System of occupational safety standards. Harmful substances. Classification and general safety requirements
GOST 12.1.019-2009 System of occupational safety standards. Electrical safety. General requirements and nomenclature of types of protection
GOST 12.4.009-83 System of occupational safety standards. Fire fighting equipment for the protection of objects. Main types. Accommodation and service
GOST 61-75 Reagents. Acetic acid. Specifications
GOST 450-77 Technical calcium chloride. Specifications
GOST 1770-74 (ISO 1042-83, ISO 4788-80) Laboratory glassware. Cylinders, beakers, flasks, test tubes. General technical conditions
GOST 2603-79 Reagents. Acetone. Specifications
GOST 3118-77 Reagents. Hydrochloric acid. Specifications
GOST 3769-78 Reagents. Ammonium sulfate. Specifications
GOST 5860-75 Reagents. Aminoacetic acid. Specifications
GOST 5867-96 Milk and dairy products. Fat determination methods
GOST 6259-75 Reagents. Glycerol. Specifications
GOST 6691-77 Reagents. Urea. Specifications
GOST 6709-72 Distilled water. Specifications
GOST 7730-89 Cellulose film. Specifications
GOST 12026-76 Laboratory filter paper. Specifications
GOST 13928-84 Prepared milk and cream. Acceptance rules, sampling methods and preparation for analysis
GOST 14919-83 Household electric stoves, electric stoves and electric frying cabinets. General technical conditions
GOST 16317-87 Household electrical refrigerating appliances. General technical conditions
GOST 20478-75 Reagents. Ammonium persulfate. Specifications
GOST 23932-90 Laboratory glassware and equipment. General technical conditions
GOST 24104-2001 * Laboratory scales. General technical requirements
________________
* GOST R 53228-2008 is in force on the territory of the Russian Federation, hereinafter in the text. - Database manufacturer's note.
GOST 25336-82 Laboratory glassware and equipment. Types, main parameters and sizes
GOST 26809-86 Milk and dairy products. Acceptance rules, sampling methods and sample preparation for analysis
GOST 27752-88 Electronic-mechanical quartz table, wall and alarm clocks. General technical conditions.
GOST 28498-90 Liquid glass thermometers. General technical requirements. Test methods
GOST 29227-91 Laboratory glassware. Graduated pipettes. Part 1. General requirements
Note - When using this standard, it is advisable to check the validity of the reference standards in the public information system - on the official website of the Federal Agency for Technical Regulation and Metrology on the Internet or according to the annually published information index "National Standards", which was published as of January 1 of the current year , and according to the corresponding monthly information indexes published in the current year. If the reference standard is replaced (changed), then when using this standard you should be guided by the replacing (changed) standard. If the reference standard is canceled without replacement, then the provision in which a reference is made to it is applied in the part that does not affect this reference.
3 Terms and definitions
This standard uses the terms established by the regulatory legal acts of the Russian Federation, GOST R 52349, GOST R 52738.
4 Essence of the method
Electrophoresis is a method for separating substances based on the phenomenon of migration of charged molecules under the influence of an external electric field.
Protein macromolecules located in a buffer solution (PAGE gel) have a certain total electrical charge, the magnitude and sign of which depend on the pH of the medium. When an electric current is passed along the gel, a certain voltage gradient is established, i.e. an electric field is formed. Under the influence of this field, protein macromolecules, in accordance with their charge, migrate towards the cathode or anode. The test sample, consisting of different molecules, is divided into zones of molecules with the same molecular weight and charge, migrating at the same speed. Over time, these zones are distributed along the length of the gel in the form of stripes and are fixed.
5 Measuring instruments, auxiliary equipment, materials, glassware and reagents
Cell for vertical electrophoresis with the following parameters:
- overall cell dimensions 260x190x300 mm;
- central temperature-controlled reservoir and tubing adapter made of molded polymer;
- lower electrode chamber and cover made of molded polycarbonate;
- clamps, pouring stand and eccentrics made of vitrified and Teflon-reinforced polycarbonate;
- electrodes made of platinum wire with a diameter of 0.254 mm;
- glass plates with dimensions: internal - 200x200 mm and external - 200x225 mm;
- voltage limit 1000 V.
Voltage source with adjustable voltage range (20-5000) V, current (0.01-500) mA and power (0.1-400) W.
A computer with characteristics not lower than: /Celeron 600/250 mb/HDD 4Gb/CD-ROM/video card 4 Mb.
Color monitor with minimum requirements: screen resolution 1024x768, color rendering quality 16-bit.
A digital camera with minimum requirements: resolution 1024x768, matrix - 1.3 million pixels.
Potentiometric analyzer with measurement range (0-12) units. pH, with a division value of 0.1 units. pH.
Laboratory scales of the 1st accuracy class (special) in accordance with GOST 24104 with limits of absolute error of single weighing ±0.0003 g.
Laboratory scale thermometer from 0 °C to 100 °C with a division value of 1 °C according to GOST 28498.
Vortex-type shaking apparatus (rotation speed 250-3000 rpm).
Solid-state thermostat of the "Gnome" type for Eppendorf tubes with a capacity of 1.5 cm with a range of operating temperatures from ambient to 99 °C.
Household electric refrigerator of any type, ensuring maintenance of the temperature in the refrigerator compartment (4±2) °C according to GOST 16317.
Household electric stove with adjustable heating of any type according to GOST 14919.
A household electric separator that provides skim milk with a fat mass fraction of no more than 0.05%.
Watch of 2nd accuracy class according to GOST 27752.
Distilled water according to GOST 6709.
Laboratory centrifuge with a rotation speed of at least 5000 rpm.
Tabletop microcentrifuge, Eppendorf type (rotation speed no less than 13,000 rpm).
Magnetic stirrer with adjustable electric heating of any type.
Water bath providing heating to a temperature of 50 °C.
Single-channel pipette dispensers of variable volume:
- working volume 0.002-0.02 cm, variable volume step 0.001 cm;
- working volume 0.02-0.2 cm, variable volume step 0.01 cm;
- working volume 0.2-1 cm, variable volume step 0.1 cm.
Laboratory filter paper according to GOST 12026.
Cellulose film according to GOST 7730.
Funnel V-75-80 HS according to GOST 25336.
Flasks of execution 2-50-2, 2-100-2, 2-500-2, 2-1000-2 according to GOST 1770.
Flasks of execution 1-100, Kn-1-50-14/23 XS, Kn-1-100-29/32 XS, Kn-1-250-24/29 XS, Kn-1-500-29/32 XS, Kn-1-2000-29/32 HS according to GOST 25336.
Cylinders of execution 1-50-2, 1-100-2, 1-1000-2 according to GOST 1770.
Desiccator according to GOST 23932.
Pipette version 1-1-2-10, 1-1-2-25 according to GOST 29227.
Water jet pump according to GOST 25336.
Microsyringe with a capacity of 0.05 cm.
Eppendorf microcentrifuge tubes with a capacity of 1.5 cm.
Glass of design V-1-50 HS, V-1-100 HS, V-1-250 HS according to GOST 25336.
Tips for variable volume pipettes 0.02, 0.2 and 1 cm.
Acrylamide (mass fraction of the main substance is not less than 99.9%).
N",N"-Methylene bisacrylamide, for electrophoresis.
Tris-(hydroxymethyl)-aminomethane (mass fraction of the main substance is not less than 99.8%).
Urea, analytical grade, according to GOST 6691.
Coomassie brilliant blue G-250, for electrophoresis.
Aminoacetic acid, chemically pure, according to GOST 5860.
Bromophenol blue, for electrophoresis.
Ammonium persulfate, chemically pure, according to GOST 20478.
N,N,N",N"-Tetramethylethylenediamine (TEMED), for electrophoresis.
Acetone, chemically pure, according to GOST 2603.
Glycerin, analytical grade, according to GOST 6259.
Diethyl ether, analytical grade, according to .
Hydrochloric acid, chemically pure, according to GOST 3118.
Ammonium sulfate, chemically pure, according to GOST 3769.
Ethyl alcohol according to GOST R 51652.
Glacial acetic acid, chemically pure, according to GOST 61.
Anhydrous calcium chloride according to GOST 450.
Distilled water according to GOST 6709.
It is allowed to use other measuring instruments, auxiliary devices and reagents with metrological or technical characteristics no worse than those specified.
6 Sampling for analysis
Basic concepts and general rules for sampling - according to GOST 13928 and GOST 26809.
Samples are transported at temperatures from 2 °C to 8 °C for no more than 12 hours.
If the analysis cannot be carried out immediately, it is recommended to store samples in the refrigerator at a temperature of (4±2) °C for no more than 24 hours.
Preservation of samples is not permitted.
7 Preparing for analysis
7.1 Preparation of solutions
7.1.1 Hydrochloric acid solution with a molar concentration of 1 mol/dm
Add about 500 cm of distilled water and 90 cm of concentrated hydrochloric acid with a density of 1.174 g/cm (or 85 cm of concentrated hydrochloric acid with a density of 1.188 g/cm) into a volumetric flask with a capacity of 1000 cm3, mix gently and bring the resulting volume with distilled water to the mark.
The shelf life of the solution is 3 months.
7.1.2 Urea solution with a molar concentration of 6 mol/dm
In a beaker with a capacity of 50 cm, (18.02 ± 0.01) g of urea is dissolved in 30 cm of distilled water, poured into a volumetric flask with a capacity of 50 cm and the resulting volume is adjusted to the mark with distilled water.
7.1.3 Lead dye solution
Place (0.0040±0.0003) g of bromophenol blue into a 1.5 cm Eppendorf microcentrifuge tube, add 1 cm of distilled water and mix on a Vortex shaker (until the dye is completely dissolved).
The shelf life of the solution at a temperature of (4±2) °C is 1 month.
7.1.4 Tris-HCl solution
In a beaker with a capacity of 100 ml, dissolve (6.070 ± 0.001) g of tris-(hydroxymethyl) aminomethane in 50 ml of distilled water, adjust with a solution of hydrochloric acid with a molar concentration of 1 mol/dm to (8.8 ± 0.1) units. pH, pour into a 100 ml volumetric flask and adjust to the mark.
7.1.5 Polyacrylamide gel monomer solution
In a conical flask with a capacity of 50 cm add (3.1040±0.0003) g of acrylamide, (0.0960±0.0003) g of N",N"-methylenebisacrylamide, (3.1040±0.0003) g of urea, add 8.75 cm of Tris-HCl solution prepared according to 7.1.4 and 26 cm of distilled water. Stir on a magnetic stirrer with electric heating at a temperature of (50±5) °C for 30 minutes and cool to room temperature.
The shelf life of the solution in a glass flask with a ground-in stopper at a temperature of (4±2) °C is 1 month.
Note - The amount of solution for polyacrylamide gel is given for one analysis and obtaining a gel measuring (160x160x1) mm.
7.1.6 Electrode buffer solution
Add (4.50 ± 0.01) g of tris-(hydroxymethyl) aminomethane and (21.60 ± 0.01) g of aminoacetic acid into a 500 cm3 volumetric flask and dissolve in 300 cm3 of distilled water, adjust the resulting volume to the mark, pour into a conical flask with a capacity of 2000 ml and add 1000 ml of distilled water.
The shelf life of the solution in a glass flask with a ground-in stopper at a temperature of (4±2) °C is 1 month.
Note—The amount of electrode buffer for one assay is given for one electrophoretic cell with the parameters specified in section 5. When using another type of electrophoretic cell, the amount of electrode buffer must be adjusted accordingly.
7.1.7 Gel staining solution
Add (0.50±0.01) g of Coomassie brilliant blue into a conical flask with a capacity of 500 ml, add 200 ml of ethyl alcohol, 50 ml of glacial acetic acid and 250 ml of distilled water. The contents of the flask are thoroughly mixed.
The shelf life of the solution in a glass flask with a ground-in stopper at a temperature of (4±2) °C is 1 month.
7.2 Preparation of control samples
To prepare control samples, raw milk is used in accordance with GOST R 52054 and with an acidity of (16.0-20.0) °T without preservatives and inhibitory substances.
7.2.1 Fat separation
7.2.1.1 Separation method
(0.4-0.5) dm of milk before separation is heated in a water bath to a temperature of (40-45) °C.
1-2 minutes after turning on the electric drive of the separator, to warm up the milk tract, 1 dm of distilled water heated to a temperature of (40-50) °C is passed through the electric separator. Next, without turning off the electric drive of the separator, preheated milk is poured in and separated. After separation, skim milk is used for further analysis.
7.2.1.2 Centrifugation method
(0.4-0.5) dm of milk is placed in centrifuge tubes or beakers and centrifuged at 5000 rpm for (20-30) minutes. After centrifugation, centrifuge tubes (glasses) are placed in a refrigerator and cooled at a temperature of (4±2) °C. Once completely cooled, the congealed top fat layer is removed and the remaining skim milk is used for further analysis.
7.2.2 Protein isolation
Add 50 cm3 of pre-skimmed milk (with a mass fraction of fat no more than 0.05% according to GOST 5867-90) into a beaker with a capacity of 250 cm3, heat it in a water bath to a temperature of (35-40) °C and precipitate casein, adding drop by drop hydrochloric acid solution prepared according to 7.1.1. The sediment is allowed to settle and the whey is carefully poured off. The precipitate is washed by adding 50 cm of distilled water, mixed, allowed to settle and the water is drained. Washing is carried out at least five times.
Add 30 cm of acetone to the washed sediment and leave for 30 minutes, then the acetone is carefully poured off. The action is repeated until the fat is completely removed, but at least five times. The precipitate is filtered through a dry folded filter and transferred to a conical flask with a capacity of 250 cm, filled with 120 cm of diethyl ether and closed with a ground stopper. Stir for at least 5 minutes and leave for 12 hours in the refrigerator. After 12 hours, the precipitate is filtered through a dry pleated filter and dried in air in a fume hood for at least 1 hour.
(10.0±0.1) g of the dried sample is transferred to a conical flask with a capacity of 100 cm3, 60 cm3 of urea solution prepared according to 7.1.2 is added, stirred on a magnetic stirrer at a temperature of (50±5) °C until the protein is completely dissolved. The resulting solution is transferred to a dialysis bag made of cellophane film, which is immersed in distilled water and placed in the refrigerator. Dialysis (removal of a solution from low molecular weight compounds) is carried out for at least 24 hours with periodic changes of distilled water. Then the resulting precipitate is filtered through a dry folded filter and dried in a desiccator over anhydrous calcium chloride for at least 4 hours.
The shelf life of isolated casein at a temperature of (4±2) °C is no more than 2 weeks.
The whey remaining after the isolation of casein is poured into a conical flask with a capacity of 250 cm and ammonium sulfate is added (per 25 cm of whey (17.5 ± 0.1) g of ammonium sulfate), and thoroughly mixed until completely dissolved. Place in the refrigerator at a temperature of (4±2) °C for 12 hours. The separated protein is filtered through a dry folded filter and transferred to a dialysis bag made of cellophane film, which is immersed in distilled water and placed in the refrigerator. Dialysis is carried out for at least 24 hours with periodic changes of distilled water. After 24 hours, the resulting precipitate is filtered through a dry folded filter and dried in a desiccator over anhydrous calcium chloride for at least 4 hours.
The shelf life of whey proteins at a temperature of (4±2) °C is no more than 2 weeks.
7.3 Preparation of test milk samples
Separation of fat and isolation of proteins from the milk samples under study is carried out according to 7.2.1 and 7.2.2.
7.4 Preparation of protein solutions
7.4.1 Preparation of protein control solutions
Place (0.0040±0.0003) g of protein isolated according to 7.2, 7.3 into a microcentrifuge tube of the Eppendorf type with a capacity of 1.5 cm, add 0.5 cm of urea solution prepared according to 7.1.2, and keep in a thermostat at temperature 95 °C for 5 minutes, mix thoroughly using a Vortex shaking apparatus until the proteins are completely dissolved. To the resulting solution add 0.2 cm of glycerol and 0.025 cm of the leading dye prepared according to 7.1.3, mix thoroughly on a Vortex shaking apparatus, centrifuge at a frequency of 3000 rpm for 5 minutes, the resulting precipitate is discarded, and the supernatant the liquid is used for analysis.
The shelf life of protein solutions at a temperature of (4±2) °C is no more than seven days.
7.4.2 Preparation of test protein solutions
The preparation of the protein solutions under study is carried out according to 7.4.1.
8 Analysis conditions
When performing the analysis, the following conditions must be met:
Ambient temperature | ||||
Relative humidity | from 30% to 80% | |||
Atmospheric pressure | from 84 to 106 kPa | |||
Mains voltage | ||||
AC frequency | ||||
9 Conducting analysis
When assembling the chamber for gel polymerization, glass plates of size are used: internal - (200x200) mm and external - (200x225) mm.
Spacers (plates) 1 mm thick are placed on the outer plate on the right and left along the long sides. An inner glass plate is placed over the spacers. The plates are secured with clamps on the right and left and placed on a pouring stand with a groove for alignment. The chamber is checked for leaks using distilled water, which is then removed. After checking the chamber for leaks, a comb is placed between the plates of the chamber at a slight angle to form holes.
To ensure the normal process of gel polymerization, the monomer solution prepared according to 7.1.5 is deaerated in a flask with a tube connected to a water-jet pump. After deaeration, (0.0180±0.0003) g of ammonium persulphate and 0.018 cm of N,N,N,N"-tetramethylethylenediamine are added to the solution and carefully mixed to prevent the formation of bubbles in the solution. Using a glass pipette with a bulb along the edge of the spacer (on the raised side of the comb), the solution is introduced into the polymerization chamber.
The gel polymerizes for 45 minutes, after which the comb is removed and the wells formed in the gel are rinsed with distilled water.
The chamber containing the gel is attached to the thermostatted part and placed in the electrophoretic cell.
Electrode buffer prepared according to 7.1.6 is poured into the electrode chambers of the cell.
Control and test protein solutions prepared according to 7.4 are added into the gel wells under the electrode buffer using a microsyringe. It is recommended to use the outermost wells of the gel for control protein solutions. The amount of solution added to one well is (0.020-0.025) cm. After each application, the microsyringe is thoroughly washed with an electrode buffer solution.
To obtain reliable results, it is recommended to add each protein solution to be tested in at least three replicates.
After adding control and test solutions, the electrophoretic cell is closed with a lid.
Electrophoresis is carried out for (4-5) hours in constant voltage mode (120-130) V.
Note - The mode is indicated for an electrophoretic cell with the parameters specified in 5, and a polyacrylamide gel with dimensions of (160x160x1) mm. When using a cell of a different type or a gel with other sizes, the electrophoresis mode is selected individually.
To prevent uneven heat distribution and distortion of protein zones (strips), it is recommended to provide forced cooling of the thermostatic tank.
Electrophoresis is considered complete when the leading dye reaches the bottom edge of the gel.
After electrophoresis, the gel is carefully removed from the electrophoretic cell, fixed and stained. Fixation and coloring are carried out simultaneously in a solution prepared in accordance with 7.1.7 for 2 hours. To speed up the process, it is allowed to stain and fix the gel for one hour on an electric stove at (40±5) °C, and a bath with a solution and The gel must be shaken regularly.
The colored gel is washed by boiling in a 10% acetic acid solution until the background is completely removed, with a constant change of the washing solution as the paint is washed out.
Appendix A provides possible reasons for deviations from the standard course of analysis and suggests ways to eliminate them.
Visualization of protein separation after electrophoresis is carried out using a camera. The resulting electropherograms are stored on a hard magnetic computer.
10 Interpretation of analysis results
Identification of proteins of dairy and non-dairy origin is carried out visually.
The coincidence of protein fractions (bands) on the electropherogram of the control and test solutions (at least three replicates) indicates the absence of non-dairy proteins in the product (Figure 1).
Figure 1 - Electropherogram of a protein solution of the test sample, which does not contain proteins of non-dairy origin
If the test sample contains proteins of non-dairy origin, the electropherogram contains additional protein fractions (bands) that are not observed in control samples (Figure 2).
Figure 2 - Electropherogram of a protein solution of the test sample, which contains a protein of non-dairy origin
If there is any doubt about the presence of non-dairy proteins in the test sample (weak image of individual fractions), it is recommended to increase the concentration of proteins in the sample and repeat the analysis.
11 Safety requirements
When conducting electrophoretic analysis, it is necessary to comply with safety requirements when working with chemical reagents in accordance with GOST 12.1.007, electrical safety requirements when working with electrical installations in accordance with GOST 12.1.019, as well as the requirements set out in the technical documentation and operating instructions for the electrophoresis cell.
The room must meet fire safety requirements in accordance with GOST 12.1.004 and have fire extinguishing equipment in accordance with GOST 12.4.009. The content of harmful substances in the air of the working area should not exceed the permissible values according to GOST 12.1.005.
When working with neurotoxins, special care should be taken; all manipulations must be carried out with rubber gloves and only in a fume hood.
A specialist with a higher or secondary specialized biochemical education, or experience working in a biochemical laboratory, who has undergone appropriate instruction and has mastered the method during the training process, is allowed to perform the analysis and process the results.
Appendix A (for reference). Reasons for deviations from the standard course of analysis and ways to eliminate them
Appendix A
(informative)
Table A.1
Deviation | Possible reasons | Remedies |
1 The stripes at the edges of the gel are located higher than in the center | The central part of the gel heats up more than the edges | Fill the central reservoir with cooling solution |
Overvoltage | Pump the cooling solution at a temperature of (10-15) °C; reduce voltage |
|
2 Diffusion of leading dye | Disintegration of sample protein solution and/or buffer solutions | Prepare solutions from fresh reagents |
Diffusion | If the protein bands have the same diffuse character as the band of the leading dye, increase: the current intensity by (25-50)% |
|
3 Vertical striation of the track | Excessive concentration of proteins in the sample | Reduce the concentration of proteins in the sample; reduce voltage by 25% |
4 Horizontal track striations | Incomplete dissolution of proteins | Completely dissolve the sample; centrifuge |
5 Wide or blurry streaks or spots of whites | Diffusion due to slow migration | Increase current by 20% |
Chemical modifications by ionic contaminants | Deionize carbamide solution |
|
Incomplete sample degreasing | Remove fat completely |
|
6 Lateral blurring of stripes | Diffusion of protein solutions beyond the wells before voltage is turned on | Reduce the time between sample application and voltage application |
7 Warped stripes | Insufficient gel polymerization around the wells | Degas the gel monomer solution; increase the concentrations of ammonium persulfate and N,N,N",N"-tetramethylethylenediamine by 25% |
Presence of salts in the sample | Remove salts by dialysis |
|
Uneven gel surface | Check the sampling stage for preparing the gel, replace reagents if necessary |
|
8 Electrophoresis takes more than 5 hours | High concentration of electrode buffer | Check the stage of preparation of the electrode buffer (if necessary, dilute the buffer), check the quality of distilled water, replace reagents |
Low voltage | Increase voltage by (25-50)% |
|
9 Electrophoresis is too fast with poor resolution | Buffer too thin | Check the preparation stage of the electrode buffer, check the quality of distilled water, replace reagents |
Voltage too high | Reduce voltage by (25-50)% |
|
10 There is a discrepancy between the bands in the control samples | Part of the protein may have oxidized during electrophoresis or was not completely reduced at the sample preparation stage | Prepare fresh control samples; replace reagents |
Bibliography
Federal Law of the Russian Federation of June 12, 2008 N 88-FZ "Technical Regulations for Milk and Dairy Products"
TU 2600-001-43852015-05 Diethyl ether
Electronic document text
prepared by Kodeks JSC and verified against:
official publication
M.: Standartinform, 2010
2 LITERATURE REVIEW.
2.1 Mass spectrometry in proteomics.
2.1.1 General principles.
2.1.2 Proteomic analysis using mass spectrometry.
2.1.3 Identification of proteins using the peptide mass fingerprint method.
2.1.4 Identification of proteins using the peptide fragmentation fingerprint method.
2.2 Interpretation of the results of mass spectrometric identification of proteins.
2.2.1 Determination of the list of identified proteins.
2.2.2 Identification of highly homologous proteins.
2.2.3 Databases of amino acid sequences of proteins.
2.3 Mass spectrometric analysis of single gene products.
2.3.1 Proteotyping and population proteomics.
2.3.2 Identification of protein microheterogeneity using the “top-down” method.
2.3.3 Identification of genetically determined protein polymorphism using the “bottom-up” method.
2.3.4 Databases of protein and gene polymorphisms.
2.3.5 Mass spectrometry data repositories.
3 MATERIALS AND METHODS.
3.1 Materials.
3.1.1 Mass spectrometric data for proteins of the microsomal fraction of human liver.
3.1.2 Control set of mass spectra “Aurum Dataset”.
3.1.3 Mass spectrometric data from the PRIDE proteomic repository.
3.1.4 Databases of amino acid sequences of human proteins.
3.1.5 Data on possible polymorphisms of human proteins.
3.2 Methods.
3.2.1 Web server for identification of proteins by mass spectra.
3.2.2 Batch processing of mass spectra using the peptide mass fingerprint method.
3.2.3 Batch processing of tandem mass spectra.
3.2.4 One-dimensional proteomic mapping.
3.2.5 Software implementation of an iterative algorithm for identifying PDAs.
3.2.6 Validation of the OAP identification algorithm.
4 RESULTS AND DISCUSSION.
4.1 Increasing the degree of coverage of amino acid sequences by identified peptides.
4.1.1 Identification of proteins in gel sections.
4.1.2 One-dimensional proteomic maps and their properties.
4.1.3 Identification of highly homologous proteins of the cytochrome P450 superfamily by increasing the degree of coverage of amino acid sequences by identified peptides.
4.2 Identification of PDAs in proteins of the cytochrome P450 superfamily.
4.3 Algorithm for identification of PDA.
4.3.1 Iterative scheme for processing tandem mass spectra.
4.3.2 Sensitivity and specificity of the PDA identification algorithm.
4.4 Application of an iterative algorithm to identify PDAs in mass spectrometric data of the PRIDE proteomic repository.
4.4.1 Initial data used to identify PDA.
4.4.2 Identification of peptides and proteins using mass spectrometry data downloaded from the PRIDE repository.
4.4.3 Identification of single amino acid polymorphisms.
4.5 Analysis of identified PDAs.
4.5.1 Analysis of OAP-containing peptides.
4.5.2 Relationship of identified PDAs with human diseases.
Recommended list of dissertations
Post-translational regulation of cytochromes P450 subfamily 2B 2013, Doctor of Biological Sciences Zgoda, Viktor Gavrilovich
Mass spectrometric determination of the activity and content of cytochromes P450 2013, Candidate of Biological Sciences Moskaleva, Natalya Evgenievna
Structural and functional mapping of proteins of cytochrome P450-containing monooxygenase systems 2002, Doctor of Biological Sciences Kolesanova, Ekaterina Fedorovna
Method for recognizing amino acid sequences in peptide mass spectra for proteomics problems 2007, candidate of technical sciences Lyutvinsky, Yaroslav Igorevich
Universal scale of chromatographic retention times of biomacromolecules in problems of “rapid-fire” proteomics 2011, Candidate of Physical and Mathematical Sciences Pridatchenko, Marina Leonidovna
Introduction of the dissertation (part of the abstract) on the topic “Analysis of mass spectra of peptide fragments for the identification of genetically determined polymorphism of proteins”
The Ensembl database contains information on 20,469 coding genes, derived from the human genome assembly performed at the US National Center for Biotechnology Information (February 2009). The small number of genes allows us to conclude that the complexity of living systems is achieved at the level of regulation of transcription, translation, and post-translational modifications. Alternative splicing and modifications such as phosphorylation, glycosylation, along with proteolytic processing, lead to the formation of a variety of proteins, the number of which exceeds the number of genes by several orders of magnitude. Estimates carried out by various methods show that the human proteome may contain several million proteins differing in their chemical structure.
The traditional approach to proteome research is based on the use of immunohistochemical staining of tissue sections. The first version of the human proteomic atlas was built using antibodies. The use of biological microarrays containing antibodies coated on them makes it possible to identify and quantify up to several hundred proteins in a single sample. However, this approach has limitations that are associated with the need to develop and verify antibodies, insufficient specificity due to cross-interactions, and the relatively low affinity of antigen-antibody complexes. In this regard, a more universal method of protein identification, biological mass spectrometry, which does not require immunospecific reagents, has acquired particular importance for proteome research.
In mass spectrometric analysis of biomaterial, identification of protein molecules is carried out by comparing the measured mass-charge characteristics of proteins and/or their proteolytic fragments with theoretical values calculated on the basis of amino acid sequences encoded in the genome. It must be taken into account that the genome sequence does not explicitly contain information about alternative splicing sites and possible post-translational modifications. Identification of cases of alternative splicing is possible on the basis of experimental data: the source of information about splice isoforms is DNA coding databases. Identification of post-translational modifications is carried out using high-precision mass spectrometry of proteins or using tandem mass spectrometry of peptide fragments
Along with alternative splicing and post-translational modification, the diversity of protein molecules increases due to the translation of non-synonymous Single Nucleotide Polymorphism (nsSNP). Determining the presence of nsSNP is done using genotyping, while confirming the presence of a corresponding residue substitution in the primary structure of the protein, that is, identifying single amino acid polymorphisms (SAP, Single Amino Acid Polymorphism, SAP), is a proteotyping task.
The importance of identifying and studying alternative splicing, PDA, and post-translational modifications at the protein level is due to the influence of these processes on the expression level and functional properties of proteins. It is known that changes in the activity or expression level of proteins can lead to the emergence and development of socially significant diseases, including cancer, cardiovascular and neurodegenerative diseases.
The presence of about 65 thousand nonsynonymous polymorphisms has been established in the genome, presumably translated into PDA, with more than 30% presumably leading to changes in the functional properties of proteins. Since changes in protein activity are associated with the development of diseases, studies of PDA are necessary to determine the structural reasons underlying the observed functional disorders. The tasks of proteotyping include qualitative and quantitative determination of the expression of allelic variants of genes at the proteomic level, as well as monitoring the frequency of occurrence of expressed allelic variants of proteins at the population level.
Identification of PDAs in high-throughput mode using mass spectrometry is associated with technical limitations. For the task of proteotyping, the most adequate approach is the “top-down” approach, that is, mass spectrometry of intact proteins (and not their fragments). However, the sensitivity of this approach is low, at the level of 10 h-10 5 M. As a result, the identification of tens, less often hundreds, and, only in exceptional cases, up to a thousand proteins is ensured. Most often, another approach is used in biological mass spectrometry - “bottom-up”, in which the presence of a protein in a sample is established by identifying its proteolytic fragments (peptides). In most cases, to identify a protein, a small number of peptides are sufficient, which together can constitute no more than 5% of the biopolymer sequence. For the remaining part of the amino acid sequence of the protein, it is impossible to determine the presence/absence of chemical modifications of amino acid residues or amino acid polymorphisms.
To identify single amino acid polymorphisms of human proteins using biological mass spectrometry, it is necessary to increase the degree of protein amino acid sequence coverage by identifying additional proteolytic peptides of the protein. This is possible by conducting an experiment with a large number of partially or fully replicated mass spectrometry analyses. In addition, data from proteomics experiments performed by multiple research groups can be combined into a single study. Access to an extensive collection of mass spectra is provided by various proteomic repositories, the most popular of which, PRIDE (Protein Identification Database), stores the results of more than 13 thousand proteomic experiments. The higher the degree of coverage of the amino acid sequence of a protein by identified peptides, the greater the likelihood of confirming the presence or absence of single amino acid substitutions in the protein structure.
Given the availability of a vast amount of mass spectrometric data, solving the problem of proteotyping is possible through the use of computational methods of bioinformatics. For example, analysis of mass spectrometry data can be carried out using expressed fragment databases (ESTs), which contain information about translated variants of nonsynonymous gene polymorphisms. The second method, implemented in many protein identification programs, is a comparison of mass spectra with a database of theoretical protein sequences, allowing for inaccuracies in the form of substitutions of amino acid residues.
The disadvantages of the above approaches are well known. Expressed fragment databases contain redundant information, including sequencing errors, which complicates the analysis of mass spectrometry results. When analyzing a sample in which several hundred proteins have been identified, the resulting mass spectra must be compared with hundreds of thousands of transcripts accumulated over decades, which contain more than 5% errors. When analyzing mass spectra with the assumption of possible inaccuracies in the database, information about actually existing non-synonymous substitutions that were established by genotyping is ignored. Artificial assumptions introduced into the database or protein identification algorithm reduce the reliability of the results. These shortcomings of existing proteotyping methods necessitate the improvement of computational approaches to PDA identification.
The goal of the work was to develop a method for analyzing mass spectrometric data to identify single amino acid polymorphisms resulting from the translation of nonsynonymous nucleotide substitutions in the corresponding genes, and to use the developed method to identify amino acid substitutions in human proteins. To achieve the goal, the following tasks were solved:
1. Process the mass spectra of peptide fragments to increase the degree of coverage of amino acid sequences of proteins by identified peptides.
2. Using a model set of mass spectrometric data that provides a high degree of sequence coverage, develop a method for identifying single-amino acid substitutions in human proteins.
3. Summarize the method for identifying single-amino acid substitutions in the form of a universal algorithm for processing tandem mass spectra; evaluate the sensitivity and specificity of the created algorithm.
4. Apply the created algorithm to process a repository of mass spectrometric data, identify single-amino acid polymorphisms and characterize human proteins containing the identified polymorphisms.
2 LITERATURE REVIEW
The term “proteome” - the complete set of proteins expressed in the body - was first proposed by Mark Wilkins in connection with the emerging need to supplement knowledge about genomes with relevant information about the proteins encoded in them. The object of study when analyzing the proteome can be either a whole organism or a cellular component, tissue, subcellular structure, for example, the nucleus, microsomal fraction, etc.
The results of a large-scale inventory of proteins using mass spectrometry were published in the work of Shevchenko et al in 1996. The advent of biological mass spectrometry marked the advent of the era of high-throughput post-genomic technologies, which make it possible to obtain information about genes and proteins on the scale of the entire organism as a result of a single experiment. Postgenomic technologies, in addition to proteomics, also include genomics and transcriptomics. When analyzing genetic material, postgenomic technologies make it possible to determine the presence of gene polymorphism using whole-genome re-sequencing or high-density mapping of single nucleotide substitutions (SNPs).
Existing approaches to studying protein diversity can be divided into two directions. In the first case, before setting up the experiment, it is predetermined which protein molecules are planned to be identified. In this approach, protein identification is carried out using antibodies, which are used for histochemical staining of tissue sections followed by obtaining micrographs of cells. In a microphotograph of a section, fluorescent areas correspond to the localization sites of the detected antigen protein, and the intensity of fluorescence allows one to obtain a quantitative assessment of the content of this protein.
As part of the large international project ProteinAtlas, large-scale production of antibodies to proteins of all human genes is being carried out. This project produced and made available for public use more than 400,000 micrographs of immunohistochemically stained sections for virtually all human tissues. A comparative analysis of the distribution of specific protein staining made it possible, in particular, to identify characteristic protein expression profiles for cancer tissues. However, staining tissue sections using fluorescently labeled antibodies is a rather crude method for studying the proteome. Firstly, as the developers of the ProteinAtlas project themselves point out, the quality of many commercially available antibodies is extremely low. When verified, approximately half of the purchased antibodies show low specificity for the antigen under study, and antibody preparations are often characterized by low purity. Secondly, a large number of antigen-antibody complexes are characterized by a dissociation constant (107-108 M), which limits the sensitivity when measuring protein concentrations.
In addition to histochemical analysis, proteome research is carried out using biological microarrays. Protein microarrays are a powerful tool for translational medicine, but are limited in their ability to be used for large-scale proteome research. The use of microarray technologies in proteomics rarely makes it possible to identify more than ten proteins at a time: with an increase in the number of analyzed proteins, standardization of the conditions for antigen-antibody interaction is difficult. Thus, the use of microchips leads to false-negative results in the case when the differences in dissociation constants for antigen-antibody complexes are several orders of magnitude. In addition, the stability of antibodies very much depends on their storage conditions, so the use of protein microarrays is limited to the time immediately after their manufacture, which does not allow this type of analysis to become widespread.
The second direction of proteome research is associated with setting up an experiment in the so-called “panoramic” (survey) mode, when it is not known in advance which proteins can be identified. Potentially, as a result of a panoramic experiment, any proteins encoded in the genome of the organism under study can be identified, including even products from regions of the genome considered to be non-coding. Technical and methodological tools for genome-wide proteome research are provided by biological mass spectrometry.
Similar dissertations in the specialty "Mathematical biology, bioinformatics", 01/03/09 code VAK
Transcriptomic-proteomic approach for the analysis of proteoforms of the HepG2 cell line 2018, Candidate of Biological Sciences Kiseleva, Olga Igorevna
Transcriptome and proteome of chromosome 18: extrapolation of analysis results to human genomes and model objects 2017, Doctor of Biological Sciences Ponomarenko, Elena Aleksandrovna
Assessment of the plasticity of the blood plasma proteome of a healthy person under extreme living conditions 2011, Candidate of Biological Sciences Trifonova, Oksana Petrovna
Search and identification of potential biomarkers of ovarian cancer in human serum 2015, Candidate of Biological Sciences Arapidi, Georgy Pavlovich
Analysis of photodynamics of protein complexes of thylakoid membranes using high-resolution mass spectrometry 2011, Candidate of Chemical Sciences Galetsky, Dmitry Nikolaevich
Conclusion of the dissertation on the topic “Mathematical biology, bioinformatics”, Chernobrovkin, Alexey Leonidovich
1. Proteomic mapping of mass spectrometric data was carried out, including identification of proteins using the peptide mass fingerprint method, followed by analysis aimed at identifying protein-specific proteotypic peptides. Using the example of proteins of the cytochrome P450 superfamily, it was shown that by mapping protein localization zones in the gel, the degree of sequence coverage by identified peptide fragments increases by 27%.
2. Proteolytic peptides specific for the forms of cytochromes P450 CYP3A4 and CYP3A5 have been identified, the sequence identity of which is 82%. Allelic variants of translation of cytochromes CYP3A4 and CYP3A5 were identified, containing single-amino acid polymorphisms M445N (ZA4), K96E (ZA4), L82R (ZA5) and D277E (ZA5).
3. An iterative algorithm has been developed to identify single-amino acid polymorphisms of proteins using tandem mass spectra of proteolytic peptides. When tested on the Aurum Dataset control set, the polymorphism detection algorithm showed a specificity of more than 95%. The sensitivity of the algorithm was 30%, which corresponds to the average coverage of the sequences included in the control set.
4. As a result of the analysis of mass spectrometric experiments deposited in the PRIDE repository, a total of 270 single-amino acid polymorphisms in 156 human proteins were identified, including 51 PDAs (45 proteins) associated with diseases, including disorders of the blood coagulation system and systemic amyloidosis.
List of references for dissertation research Candidate of Biological Sciences Chernobrovkin, Alexey Leonidovich, 2012
1. Archakov A.I. etc. A method for increasing the accuracy of determining the sequence of amino acid residues of a biopolymer based on mass spectrometric analysis data, computer system //2010.
2. Archakov A.I. et al. Cytochromes P450, drug disease and personalized medicine. Part 1 // Clinical medicine. 2008. T. 86. No. 2. P. 4-8.
3. Klyuev N.A., Brodsky E.S. Modern methods of mass spectrometric analysis of organic compounds // Ros. chem. and. (J. Russian Chemical Society named after D.I. Mendeleev). 2002. T. XLVI. No. 4. P. 57-63.
4. Fox A.B. et al. One-dimensional proteomic mapping of human liver cytochromes P450 // Biochemistry. 2009. T. 74. No. 2. P. 153-161.
5. Myasoedova K.N. New in the study of cytochromes P450 // Biochemistry. 2008. T. 73. No. 9. pp. 1199-1205.
6. Petushkova N.A. et al. Identification of cytochromes P450 of microsomes of human liver cells using mass spectrometry // Biomedical chemistry. 2007. T. 53. No. 4. pp. 400-11.
7. Ponomarenko E.A., Ilgisonis E.V., Lisitsa A.B. Technologies of knowledge in proteomics // Bioorganic chemistry. 2011. T. 37. No. 2. P. 190-198.
8. Ponomarenko E.A. et al. Identification of differentially expressed proteins using automatic meta-analysis of proteomic publications // Biomedical chemistry. 2009. T. 3. No. 1. P. 10-16.
9. Savelyeva M. et al. The significance of genetic polymorphism of cytochrome P450 isoenzymes for personalized selection and dosing regimens of antidepressants and antipsychotics // Clinical Medicine. 2008. T. 86. No. 11. P. 22-28.
10. A gene-centric human proteome project: HUPO~the Human Proteome organization. // Molecular & cellular proteomics: MCP. 2010. T. 9. No. 2. P. 4279.
11. Aebersold R., Mann M. Mass spectrometry-based proteomics. //Nature. 2003. T. 422. No. 6928. P. 198-207.
12. Ahrne E., Mtiller M., Lisacek F. Unrestricted identification of modified proteins using MS/MS // Proteomics. 2010. T. 10. No. 4. P. 671-686.
13. Akiyama M. h «p. Ichthyosis bullosa of Siemens: its correct diagnosis facilitated by molecular genetic testing. // The British journal of dermatology. 2005. T. 152. No. 6. C. 1353-6.
14. Alves G. h jxp. Calibrating E-values for MS2 database search methods. // Biology direct. 2007. T. 2. No. 1. P. 26.
15. Alves G., Ogurtsov A.Y., Yu Y.-K. RAId DbS: mass-spectrometry based peptide identification web server with knowledge integration. // BMC genomics. 2008. T. 9. P. 505.
16. Archakov A. h zip. Biospecific irreversible fishing coupled with atomic force microscopy for detection of extremely low-abundant proteins. // Proteomics. 2009. T. 9. No. 5. P. 1326-43.
17. Archakov A. h ap. Gene-centric view on the human proteome project: the example of the Russian roadmap for chromosome 18. // Proteomics. 2011. T. 11. No. 10. P. 1853-6.
18. Archakov A.I. h zip. AFM fishing nanotechnology is the way to reverse the Avogadro number in proteomics. // Proteomics. 2007. T. 7. No. 1. P. 4-9.
19. Archakov A.I., Bachmanova G.I. Cytochrome P-450 and active oxygen. London: Taylor & Francis, 1990.
20. Asara J.M. h ^p. A label-free quantification method by MS/MS TIC compared to SILAC and spectral counting in a proteomics screen. // Proteomics. 2008. T. 8. No. 5. P. 994-9.
21. Bairoch A., Apweiler R. The SWISS-PROT protein sequence database and its supplement TrEMBL in 2000. // Nucleic acids research. 2000. T. 28. No. 1. P. 45-8.
22. Baldwin M. a. Protein identification by mass spectrometry: issues to be considered. //Molecular & cellular proteomics: MCP. 2004. T. 3. No. 1. P. 1-9.
23. Bantscheff M. h ap. Quantitative chemical proteomics reveals mechanisms of action of clinical ABL kinase inhibitors. // Nature biotechnology. 2007a. T. 25. No. 9. pp. 1035-44.
24. Bantscheff M. h,qp. Quantitative mass spectrometry in proteomics: a critical review. //Analytical and bioanalytical chemistry. 2007b. T. 389. No. 4. P. 1017-31.
25. Barsnes H. h ap. PRIDE Converter: making proteomics data-sharing easy. // Nature biotechnology. 2009. T. 27. No. 7. P. 598-9.
26. Baumgardner L.A. h Fast parallel tandem mass spectral library searching using GPU hardware acceleration. // Journal of proteome research. 2011. T. 10. No. 6. P. 2882-8.
27. Beck F. h ap. The good, the bad, the ugly: Validating the mass spectrometric analysis of modified peptides // PROTEOMICS. 2011. C. n/a-n/a.
28. Bell A.W. h/jp. The protein microscope: incorporating mass spectrometry into cell biology. //Nature methods. 2007. T. 4. No. 10. P. 783-4.
29. Binz P.-A. h ,qp. A Molecular Scanner To Automate Proteomic Research and To Display Proteome Images // Analytical Chemistry. 1999. T. 71. No. 21. P. 49814988.
30. Binz P.-A. h pp. The molecular scanner: concept and developments. // Current opinion in biotechnology. 2004. T. 15. No. 1. pp. 17-23.
31. Birney E. h ap. An overview of Ensembl. // Genome research. 2004. T. 14. No. 5. P. 925-8.
32. Birney E., Clamp M., Hubbard T. Databases and tools for browsing genomes. // Annual review of genomics and human genetics. 2002. T. 3. P. 293-310.
33. Bochet P. h flp. Fragmentation-free LC-MS can identify hundreds of proteins // PROTEOMICS. 2010. T. 11. No. 1. C. n/a-n/a.
34. Boguski M.S., Lowe T.M., Tolstoshev C.M. dbEST-database for "expressed sequence tags". //Nature genetics. 1993. T. 4. No. 4. P. 332-3.
35. Borges C.R. hnp. Full-length characterization of proteins in human populations. // Clinical chemistry. 2010. T. 56. No. 2. P. 202-11.
36. Bromberg Y., Rost B. SNAP: predict effect of non-synonymous polymorphisms on function. //Nucleic acids research. 2007. T. 35. No. 11. P. 3823-35.
37. Brosch M. h np. Comparison of Mascot and XITandem performance for low and high accuracy mass spectrometry and the development of an adjusted Mascot threshold. // Molecular & cellular proteomics: MCP. 2008. T. 7. No. 5. P. 962-70.
38. Bunger M.K. h ^p. Detection and validation of non-synonymous coding SNPs from orthogonal analysis of shotgun proteomics data. // Journal of proteome research. 2007. T. 6. No. 6. P. 2331-40.
39. Bunkenborg J. h jip. Screening for N-glycosylated proteins by liquid chromatography mass spectrometry. // Proteomics. 2004. T. 4. No. 2. P. 454-65.
40. Butenas S., Mann K.G., Butenas B. Blood Coagulation. : MAIK Nauka/Interperiodica distributed exclusively by Springer Science+Business Media LLC., 2002.
41. Canas B. h jyp. Mass spectrometry technologies for proteomics. // Briefings in functional genomics & proteomics. 2006. T. 4. No. 4. P. 295-320.
42. Care M.A. h Deleterious SNP prediction: be mindful of your training data! // Bioinformatics (Oxford, England). 2007. T. 23. No. 6. P. 664-72.
43. Casado-Vela J. h flp. Lights and shadows of proteomic technologies for the study of protein species including isoforms, splicing variants and protein post-translational modifications. // Proteomics. 2011. T. 11. No. 4. pp. 590-603.
44. Chapman P.F. hap. Genes, models and Alzheimer's disease // Trends in Genetics. 2001. T. 17. No. 5. P. 254-261.
45. Chen M. h ap. Annotation of Non-Synonymous Single Polymorphisms in Human Liver Proteome by Mass Spectrometry // Protein and Peptide Letters. 2010. T. 17. No. 3. pp. 277-286.
46. Chen R. h zip. Glycoproteomics analysis of human liver tissue by combination of multiple enzyme digestion and hydrazide chemistry. // Journal of proteome research. 2009. T. 8. No. 2. P. 651-61.
47. Choudhary J.S. h Interrogating the human genome using uninterpreted mass spectrometry data. // Proteomics. 2001a. T. 1. No. 5. P. 651-67.
48. Choudhary J.S. h "p. Matching peptide mass spectra to EST and genomic DNA databases. // Trends in biotechnology. 2001b. T. 19. No. 10 Suppl. C. S17-22.
49. Choudhury V. h ap. Two novel antithrombin variants (L99V and Q118P) which alter the heparin binding // Nouvelle Revue Française. 1994. T. 36. P. 268.
50. Colinge J., Bennett K.L. Introduction to computational proteomics. // PLoS computational biology. 2007. T. 3. No. 7. C. el 14.
51. Cooksey A.M. hap. Identifying blood biomarkers and physiological processes that distinguish humans with superior performance under psychological stress. //PloS one. 2009. T. 4. No. 12. P. e8371.
52. Cooper D. The human gene mutation database // Nucleic Acids Research. 1998. T. 26. No. l.C. 285-287.
53. Côté R.G. h up. The Ontology Lookup Service: more data and better tools for controlled vocabulary queries. // Nucleic acids research. 2008. T. 36. No. Web Server issue. C.W372-6.
54. Cottrell J.S. Protein identification by peptide mass fingerprinting. // Peptide research. 1994. T. 7. No. 3. P. 115-24.
55. Craig R., Beavis R.C. TANDEM: matching proteins with tandem mass spectra. // Bioinformatics (Oxford, England). 2004. T. 20. No. 9. P. 1466-7.
56. Craig R., Cortens J.P., Beavis R.C. Open source system for analyzing, validating, and storing protein identification data. // Journal of proteome research. 2004. T. 3. No. 6. P. 1234-42.
57. Creasy D.M., Cottrell J.S. Error tolerant searching of uninterpreted tandem mass spectrometry data // PROTEOMICS. 2002. T. 2. No. 10. P. 1426-1434.
58. Crockett D.K. hap. Annotated proteome of a human T-cell lymphoma. // Journal of biomolecular techniques: JBT. 2005. T. 16. No. 4. P. 341-6.
59. Dai D. h jvp. Identification of Variants of CYP3A4 and Characterization of Their Abilities to Metabolize Testosterone and Chlorpyrifos // J. Pharmacol. Exp. Ther. 2001. T. 299. No. 3. P. 825-831.
60. Delahunty C., Yates J.R. Identification of proteins in complex mixtures using liquid chromatography and mass spectrometry. // Current protocols in cell biology / editorial board, Juan S. Bonifacino. et al.. 2003. T. Chapter 5. C. Unit 5.6.
61. Delahunty C.M., Iii J.R.Y. Tech Insight MudPIT: multidimensional protein identification technology Tech Insight // Biotechniques. 2007. T. 43. No. 5.
62. Desiere F. h jjp. The PeptideAtlas project. // Nucleic acids research. 2006. T. 34. No. Database issue. C. D655-8.
63. Deutsch E. mzML: a single, unifying data format for mass spectrometer output. // Proteomics. 2008. T. 8. No. 14. P. 2776-7.
64. Deutsch E.W. The PeptideAtlas Project. // Methods in molecular biology (Clifton, N.J.). 2010. T. 604. pp. 285-96.
65. Deutsch E.W. h ^p. A guided tour of the Trans-Proteomic Pipeline. // Proteomics. 2010. T. 10. No. 6. C. 1150-9.
66. Deutsch E.W. h ^p. Human Plasma PeptideAtlas. // Proteomics. 2005. T. 5. No. 13. P. 3497-500.
67. Deutsch E.W., Lam H., Aebersold R. PeptideAtlas: a resource for target selection for emerging targeted proteomics workflows. // EMBO reports. 2008. T. 9. No. 5. P. 429-34.
68. Eckel-Passow J.E. hjsp. An insight into high-resolution mass-spectrometry data. // Biostatistics (Oxford, England). 2009. T. 10. No. 3. P. 481-500.
69. Eng J.K., McCormack A.L., Yates III J.R. An approach to correlate tandem mass spectral data of peptides with amino acid sequences in a protein database // Journal of the American Society for Mass Spectrometry. 1994. T. 5. No. 11. P. 976-989.
70. Eriksson J., Fenyo D. Probity: A Protein Identification Algorithm with Accurate Assignment of the Statistical Significance of the Results // Journal of Proteome Research. 2004. T. 3. No. 1. P. 32-36.
71. Falkner J. a h up. Validated MALDI-TOF/TOF mass spectra for protein standards. // Journal of the American Society for Mass Spectrometry. 2007. T. 18. No. 5. P. 850-5.
72. Farrah T. h A high-confidence human plasma proteome reference set with estimated concentrations in PeptideAtlas. // Molecular & cellular proteomics: MCP. 2011.
73. Field D., Wilson G., Gast C. van der. How do we compare hundreds of bacterial genomes? // Current opinion in microbiology. 2006. T. 9. No. 5. P. 499-504.
74. Frazer K. a h ap. A second generation human haplotype map of over 3.1 million SNPs. //Nature. 2007. T. 449. No. 7164. P. 851-61.
75. Fredman D. h ap. HGVbase: a curated resource describing human DNA variation and phenotype relationships. // Nucleic acids research. 2004. T. 32. No. Database issue. C.D516-9.
76. Freed G.L. h ^p. Differential capture of serum proteins for expression profiling and biomarker discovery in pre- and posttreatment head and neck cancer samples. // The Laryngoscope. 2008. T. 118. No. 1. P. 61-8.
77. Gabellini N. NTRK2 (Neurotrophic tyrosine kinase, receptor, type 2) // Atlas Genet Cytogenet Oncol Haematol. 2008. T. 12. No. 4. P. 314-317.
78. Galeva N. Direct Identification of Cytochrome P450 Isozymes by Matrix-assisted Laser Desorption/Ionization Time of Flight-Based Proteomic Approach // Drug Metabolism and Disposition. 2003. T. 31. No. 4. P. 351-355.
79. Galeva N., Altermann M. Comparison of one-dimensional and two-dimensional gel electrophoresis as a separation tool for proteomic analysis of rat liver microsomes: cytochromes P450 and other membrane proteins. // Proteomics. 2002. T. 2. No. 6. P. 713-22.
80. Gao M. h j\p. Large scale depletion of the high-abundance proteins and analysis of middle- and low-abundance proteins in human liver proteome by multidimensional liquid chromatography. // Proteomics. 2008. T. 8. No. 5. P. 93947.
81. Garcia-Blanco M. a, Baraniak A. P., Lasda E. L. Alternative splicing in disease and therapy. // Nature biotechnology. 2004. T. 22. No. 5. P. 535-46.
82. Gatlin C.L. hap. Automated Identification of Amino Acid Sequence Variations in Proteins by HPLC/Microspray Tandem Mass Spectrometry // Analytical Chemistry. 2000. T. 72. No. 4. P. 757-763.
83. Gobom J. h £p. A Calibration Method That Simplifies and Improves Accurate Determination of Peptide Molecular Masses by MALDI-TOF MS // Analytical Chemistry. 2002. T. 74. No. 15. P. 3915-3923.
84. Griss J. h ap. Published and Perished? the influence of the searched protein database on the long-term storage of proteomics data. // Molecular & cellular proteomics: MCP. 2011. T. 10. No. 9. C. Ml 11.008490.
85. Grone J. h ^p. Differential expression of genes encoding tight junction proteins in colorectal cancer: frequent dysregulation of claudin-1, -8 and -12. // International journal of colorectal disease. 2007. T. 22. No. 6. P. 651-9.
86. Hamosh A. h £p. Online Mendelian Inheritance in Man (OMIM), a knowledgebase of human genes and genetic disorders. // Nucleic acids research. 2005. T. 33. No. Database issue. C. D514-7.
87. Hamosh A. h ap. Online Mendelian Inheritance in Man (OMIM). // Human mutation. 2000. T. 15. No. 1. P. 57-61.
88. Han X., Aslanian A., Yates III J.R. Mass spectrometry for proteomics // Current Opinion in Chemical Biology. 2008. T. 12. No. 5. P. 483-490.
89. Hedden P. h ap. Gibberellin Biosynthesis in Plants and Fungi: A Case of Convergent Evolution? // Journal of plant growth regulation. 2001. T. 20. No. 4. P. 319-331.
90. Hopfgartner G. h Triple quadrupole linear ion trap mass spectrometer for the analysis of small molecules and macromolecules. // Journal of mass spectrometry: JMS. 2004. T. 39. No. 8. P. 845-55.
91. Huang Y. n flp. Statistical characterization of the charge state and residue dependence of low-energy CID peptide dissociation patterns. // Analytical chemistry. 2005. T. 77. No. 18. P. 5800-13.
92. Hubbard T. The Ensembl genome database project // Nucleic Acids Research. 2002. T. 30. No. 1. P. 38-41.
93. Hustert E. h £p. The genetic determinants of the CYP3A5 polymorphism. // Pharmacogenetics. 2001. T. 11. No. 9. p. 773-9.
94. Ilina E.N. h ^p. Direct bacterial profiling by matrix-assisted laser desorption-ionization time-of-flight mass spectrometry for identification of pathogenic Neisseria. // The Journal of molecular diagnostics: JMD. 2009. T. 11. No. 1. P. 7586.
95. Ingelman-Sundberg M. Human drug metabolizing cytochrome P450 enzymes: properties and polymorphisms. // Naunyn-Schmiedeberg's archives of pharmacology. 2004. T. 369. No. 1. P. 89-104.
96. International Human Genome Sequencing Consortium. Finishing the euchromatic sequence of the human genome. //Nature. 2004. T. 431. No. 7011. P. 931 -45.
97. Ishihama Y. h pp. Exponentially modified protein abundance index (emPAI) for estimation of absolute protein amount in proteomics by the number of sequenced peptides per protein. // Molecular & cellular proteomics: MCP. 2005. T. 4. No. 9. P. 1265-72.
98. Jain R., Wagner M. Kolmogorov-Smirnov scores and intrinsic mass tolerances for peptide mass fingerprinting. // Journal of proteome research. 2010. T. 9. No. 2. P. 737-42.
99. Jeffrey L. Cummings. Genotype-proteotype-phenotype relationships in neurodegenerative diseases. : Springer, 2005.
100. Jenkins R.E. hap. Relative and absolute quantitative expression profiling of P450 cytochromes using isotope-coded affinity tags. // Proteomics. 2006. T. 6. No. 6. P. 1934-47.
101. Jones P. h flp. PRIDE: a public repository of protein and peptide identifications for the proteomics community. // Nucleic acids research. 2006. T. 34. No. Database issue. C. D659-63.
102. Jones P. h flp. PRIDE: new developments and new datasets. // Nucleic acids research. 2008. T. 36. No. Database issue. C. D878-83.
103. Kalmar L. h jip. Mutation screening of the CI inhibitor gene among Hungarian patients with hereditary angioedema. // Human mutation. 2003. T. 22. No. 6. P. 498.
104. Keller A. h ap. Empirical Statistical Model To Estimate the Accuracy of Peptide Identifications Made by MS/MS and Database Search // Analytical Chemistry. 2002. T. 74. No. 20. P. 5383-5392.
105. Kersey P.J. n jjp. The International Protein Index: an integrated database for proteomics experiments. // Proteomics. 2004. T. 4. No. 7. P. 1985-8.
106. Kim S., Gupta N., Pevzner P. a. Spectral probabilities and generating functions of tandem mass spectra: a strike against decoy databases. // Journal of proteome research. 2008. T. 7. No. 8. P. 3354-63.
107. Klie S. h £p. Analyzing large-scale proteomics projects with latent semantic indexing. // Journal of proteome research. 2008. T. 7. No. 1. P. 182-91.
108. Kremer H. h up. Ichthyosis Bullosa of Siemens Is Caused by Mutations in the Keratin 2e Gene. // Journal of Investigative Dermatology. 1994. T. 103. No. 3. P. 286-289.
109. Kuehl P. h ap. Sequence diversity in CYP3A promoters and characterization of the genetic basis of polymorphic CYP3A5 expression. //Nature genetics. 2001. T. 27. No. 4. pp. 383-91.
110. Kuhn R.M. h up. The UCSC Genome Browser Database: update 2009. // Nucleic acids research. 2009. T. 37. No. Database issue. C. D755-61.
111. Kuster B. h flp. Mass spectrometry allows direct identification of proteins in large genomes. //Proteomics. 2001. T. 1. No. 5. p. 641-50.
112. Lane C.S. hap. Comparative cytochrome P450 proteomics in the livers of immunodeficient mice using 180 stable isotope labeling. // Molecular & cellular proteomics: MCP. 2007. T. 6. No. 6. P. 953-62.
113. Lane C.S. h ,qp. Identification of cytochrome P450 enzymes in human colorectal metastases and the surrounding liver: a proteomic approach. // European journal of cancer (Oxford, England: 1990). 2004. T. 40. No. 14. P. 2127-34.
114. Lane E.B., McLean W.H.I. Keratins and skin disorders. // The Journal of pathology. 2004. T. 204. No. 4. P. 355-66.
115. Levine a J. P53, the Cellular Gatekeeper for Growth and Division. // Cell. 1997. T. 88. No. 3. P. 323-31.
116. Levy S. h AP- The diploid genome sequence of an individual human. // PLoS biology. 2007. T. 5. No. 10. P. e254.
117. Lewis D.F.V. 57 varieties: the human cytochromes P450. // Pharmacogenomics. 2004. T. 5. No. 3. P. 305-18.
118. Lim A. h ap. Characterization of Transthyretin Variants in Familial Transthyretin Amyloidosis by Mass Spectrometric Peptide Mapping and DNA Sequence Analysis // Analytical Chemistry. 2002. T. 74. No. 4. pp. 741-751.
119. Lim H. Identification of 2D-gel proteins: A comparison of MALDI/TOF peptide mass mapping to p LC-ESI tandem mass spectrometry // Journal of the American Society for Mass Spectrometry. 2003. T. 14. No. 9. P. 957-970.
120. Lisitsa A.V. h "p. Application of slicing of one-dimensional gels with subsequent slice-by-slice mass spectrometry for the proteomic profiling of human liver cytochromes P450. // Journal of protein research. 2010. T. 9. No. 1. P. 95-103.
121. Liu T. h ap. High dynamic range characterization of the trauma patient plasma proteome. // Molecular & cellular proteomics: MCP. 2006. T. 5. No. 10. P. 1899913.
122. Liu T. h/ip. Human Plasma N-Glycoproteome Analysis by Immunoaffinity Subtraction, Hydrazide Chemistry, and Mass Spectrometry // Journal of proteome research. 2005. T. 4. No. 6. pp. 2070-2080.
123. Mallick P. h flp. Computational prediction of proteotypic peptides for quantitative proteomics. //Nature biotechnology. 2007. T. 25. No. 1. P. 125-31.
124. Mann M., Jensen O.N. Proteomic analysis of post-translational modifications. // Nature biotechnology. 2003. T. 21. No. 3. P. 255-61.
125. Mann M., Wilm M. Error-Tolerant Identification of Peptides in Sequence Databases by Peptide Sequence Tags // Analytical Chemistry. 1994. T. 66. No. 24. pp. 4390-4399.
126. Marchetti A. h pp. Frequent mutations in the neurotrophic tyrosine receptor kinase gene family in large cell neuroendocrine carcinoma of the lung. // Human mutation. 2008. T. 29. No. 5. P. 609-16.
127. Marichal P. h Contribution of mutations in the cytochrome P450 14(alpha)-demethylase (Ergllp, Cyp51p) to azole resistance in Candida albicans // Microbiology. 1999. T. 145. No. 10. P. 2701-2713.
128. Martens L. h jxp. PRIDE: the proteomics identifications database. // Proteomics. 2005. T. 5. No. 13. pp. 3537-45.
129. Matthiesen R., Amorim A. Proteomics facing the combinatorial problem. // Methods in molecular biology (Clifton, N.J.). 2010. T. 593. pp. 175-86.
130. McDonald W.H., Yates J.R. Shotgun proteomics: integrating technologies to answer biological questions. // Current opinion in molecular therapeutics. 2003. T. 5. No. 3. P. 302-9.
131. Menon R., Omenn G.S. Proteomic characterization of novel alternative splice variant proteins in human epidermal growth factor receptor 2/neu-induced breast cancers. // Cancer research. 2010. T. 70. No. 9. P. 3440-9.
132. Menschaert G. h £p. Peptidomics coming of age: a review of contributions from a bioinformatics angle. // Journal of proteome research. 2010. T. 9. No. 5. P. 205161.
133. Millar D.S. h Three novel missense mutations in the antithrombin III (AT3) gene causing recurrent venous thrombosis. // Human genetics. 1994. T. 94. No. 5. P. 509-12.
134. Mironov A.A. Frequent Alternative Splicing of Human Genes // Genome Research. 1999. T. 9. No. 12. P. 1288-1293.
135. Modrek B. Genome-wide detection of alternative splicing in expressed sequences of human genes // Nucleic Acids Research. 2001. T. 29. No. 13. pp. 2850-2859.
136. Mueller M. h ap. Analysis of the experimental detection of central nervous system-related genes in human brain and cerebrospinal fluid datasets. // Proteomics. 2008. T. 8. No. 6. P. 1138-48.
137. Nagaraj S.H., Gasser R.B., Ranganathan S. A hitchhiker's guide to expressed sequence tag (EST) analysis. // Briefings in bioinformatics. 2007. T. 8. No. 1. P. 621.
138. Nedelkov D. Population proteomics: Investigation of protein diversity in human populations // Proteomics. 2008. T. 8. No. 4. pp. 779-86.
139. Nedelkov D. h ap. High-throughput comprehensive analysis of human plasma proteins: a step toward population proteomics. // Analytical chemistry. 2004. T. 76. No. 6. P. 1733-7.
140. Nedelkov D. h ^p. Investigating diversity in human plasma proteins. // Proceedings of the National Academy of Sciences of the United States of America. 2005. T. 102. No. 31. P. 10852-7.
141. Nesvizhskii A.I. Protein identification by tandem mass spectrometry and sequence database searching. // Methods in molecular biology (Clifton, N.J.). 2007. T. 367. pp. 87-119.
142. Nesvizhskii A.I., Vitek O., Aebersold R. Analysis and validation of proteomic data generated by tandem mass spectrometry // Nature Methods. 2007. T. 4. No. 10. P. 787-797.
143. Ng P.C. hflp. Genetic Variation in an individual human exome // PLoS Genetics. 2008. T. 4. No. 8.
144. Ong S.-E., Mann M. Mass spectrometry-based proteomics turns quantitative. // Nature chemical biology. 2005. T. 1. No. 5. p. 252-62.
145. Ossipova E., Fenyô D., Eriksson J. Optimizing search conditions for the mass fingerprint-based identification of proteins. // Proteomics. 2006. T. 6. No. 7. P. 2079-85.
146. Overbeek R. h, np. Annotation of bacterial and archaeal genomes: improving accuracy and consistency. // Chemical reviews. 2007. T. 107. No. 8. P. 3431-47.
147. Pedrioli P.G.A. Trans-proteomic pipeline: a pipeline for proteomic analysis. // Methods in molecular biology (Clifton, N.J.). 2010. T. 604. pp. 213-38.
148. Perkins D.N. h ^p. Probability-based protein identification by searching sequence databases using mass spectrometry data // Electrophoresis. 1999. T. 20. No. 18. pp. 3551-3567.
149. Perry D.J., Carrell R.W. Molecular genetics of human antithrombin deficiency. // Human mutation. 1996. T. 7. No. 1. P. 7-22.
150. Petrak J. h ap. Déjà vu in proteomics. A hit parade of repeatedly identified differentially expressed proteins. // Proteomics. 2008. T. 8. No. 9. P. 1744-9.
151. Pevzner P.A. h/ip. Efficiency of database search for identification of mutated and modified proteins via mass spectrometry. // Genome research. 2001. T. 11. No. 2. P. 290-9.
152. Porter C.J., Talbot C.C., Cuticchia A.J. Central mutation databases-a review. // Human mutation. 2000. T. 15. No. 1. P. 36-44.
153. Rabilloud T., Hochstrasser D., Simpson R.J. Is a gene-centric human proteome project the best way for proteomics to serve biology? // Proteomics. 2010. pp. 1-6.
154. Rapsilber J. h £p. Large-scale proteomic analysis of the human spliceosome. // Genome research. 2002. T. 12. No. 8. P. 1231-45.
155. Redlich G. h zip. Distinction between human cytochrome P450 (CYP) isoforms and identification of new phosphorylation sites by mass spectrometry. // Journal of proteome research. 2008. T. 7. No. 11. P. 4678-88.
156. Reid G.E., McLuckey S.A. "Top down" protein characterization via tandem mass spectrometiy. // Journal of mass spectrometry: JMS. 2002. T. 37. No. 7. P. 663-75.
157. Rodriguez C. h zip. Proteotyping of human haptoglobin by MALDI-TOF profiling: Phenotype distribution in a population of toxic oil syndrome patients. // Proteomics. 2006. T. 6. C. S272--81.
158. Roher A. h zip. Structural alterations in the peptide backbone of beta-amyloid core protein may account for its deposition and stability in Alzheimer's disease // J. Biol. Chem. 1993. T. 268. No. 5. pp. 3072-3083.
159. Rostami-Hodjegan A., Tucker G.T. Simulation and prediction of in vivo drug metabolism in human populations from in vitro data. // Nature reviews. Drug discovery. 2007. T. 6. No. 2. P. 140-8.
160. Roth M.J. h zip. "Proteotyping": population proteomics of human leukocytes using top down mass spectrometry. // Analytical chemistry. 2008. T. 80. No. 8. P. 285766.
161. Rozman D., Waterman M.R. Lanosterol 14alpha -Demethylase (CYP51) and Spermatogenesis // Drug Metab. Dispos. 1998. T. 26. No. 12. P. 1199-1201.
162. Rubina A.Y. h zip. Why 3-D? Gel-based microarrays in proteomics. // Proteomics. 2008. T. 8. No. 4. pp. 817-31.
163. Sadygov R.G., Cociorva D., Iii J.R.Y. Large-scale database searching using tandem mass spectra: Looking up the answer in the back of the book // Nature Methods. 2004. T. 1. No. 3. P. 195-202.
164. Sarkozy A. h zip. Germline BRAF mutations in Noonan, LEOPARD, and cardiofaciocutaneous syndromes: molecular diversity and associated phenotypic spectrum. // Human mutation. 2009. T. 30. No. 4. P. 695-702.
165. Sattelle D.B., Jones A.K., Buckingham S.D. Insect genomes: challenges and opportunities for neuroscience. // Invertebrate neuroscience: IN. 2007. T. 7. No. 3. P. 133-6.
166. Schandorff S. h, np. A mass spectrometry-friendly database for cSNP identification. //Nature methods. 2007. T. 4. No. 6. P. 465-6.
167. Schmuth M. h Ichthyosis update: towards a function-driven model of pathogenesis of the disorders of cornification and the role of corneocyte proteins in these disorders. //Advances in dermatology. 2007. T. 23. pp. 231-56.
168. Schweigert F.J., Wirth K., Raila J. Characterization of the microheterogeneity of transthyretin in plasma and urine using SELDI-TOF-MS immunoassay. // Proteome science. 2004. T. 2. No. 1. P. 5.
169. Searle B.C., Turner M., Nesvizhskii A.I. Improving sensitivity by probabilistically combining results from multiple MS/MS search methodologies. // Journal of proteome research. 2008. T. 7. No. 1. P. 245-53.
170. Seo J., Lee K.-J. Post-translational modifications and their biological functions: proteomic analysis and systematic approaches. // Journal of biochemistry and molecular biology. 2004. T. 37. No. 1. pp. 35-44.
171. Sherry S.T. dbSNP: the NCBI database of genetic variation // Nucleic Acids Research. 2001. T. 29. No. 1. P. 308-311.
172. Shevchenko A. h j\p. Mass Spectrometric Sequencing of Proteins from Silver-Stained Polyacrylamide Gels // Analytical Chemistry. 1996. T. 68. No. 5. P. 850858.
173. Shi W.-feng h up. Proteotyping: A new approach studying influenza virus evolution at the protein level // Virologica Sinica. 2008. T. 22. No. 5. P. 405-411.
174. Shteynberg D. h np. iProphet: Multi-level integrative analysis of shotgun proteomic data improves peptide and protein identification rates and error estimates. // Molecular & cellular proteomics: MCP. 2011. C. Ml 11.007690-.
175. Smigielski E.M. dbSNP: a database of single nucleotide polymorphisms // Nucleic Acids Research. 2000. T. 28. No. 1. P. 352-355.
176. Srebrow A., Kornblihtt A.R. The connection between splicing and cancer. // Journal of cell science. 2006. T. 119. No. Pt 13. P. 2635-41.
177. Stamm S. h zip. ASD: a bioinformatics resource on alternative splicing. // Nucleic acids research. 2006. T. 34. No. Database issue. C. D46-55.
178. Stein P.E., Carrell R.W. What do dysfunctional serpins tell us about molecular mobility and disease? // Nature Structural Biology. 1995. T. 2. No. 2. P. 96-113.
179. Supek F. n zip. Enhanced analytical power of SDS-PAGE using machine learning algorithms. //Proteomics. 2008. T. 8. No. 1. pp. 28-31.
180. Taylor C.F. Minimum reporting requirements for proteomics: a MIAPE primer. // Proteomics. 2006. T. 6 Suppl 2. pp. 39-44.
181. Taylor C.F. h zip. The minimum information about a proteomics experiment (MIAPE). // Nature biotechnology. 2007. T. 25. No. 8. P. 887-93.
182. Thiede B. h zip. Peptide mass fingerprinting. // Methods (San Diego, Calif.). 2005. T. 35. No. 3. P. 237-47.
183. Tsvetkov P.O. h zip. Isomerization of the Asp7 residue results in zinc-induced oligomerization of Alzheimer's disease amyloid beta(l-16) peptide. // Chembiochem: a European journal of chemical biology. 2008. T. 9. No. 10. P. 1564-7 .
184. Uhlen M. h zip. A human protein atlas for normal and cancer tissues based on antibody proteomics. // Molecular & cellular proteomics: MCP. 2005. T. 4. No. 12. P. 1920-32.
185. Ullrich A. h zip. CANCER-RELATED PROTEIN KINASES // US Patent App. 12/. 2007.
186. Venter J.C. h zip. The sequence of the human genome. // Science (New York, N.Y.). 2001. T. 291. No. 5507. P. 1304-51.
187. Vizcaino J.A., Foster J.M., Martens L. Proteomics data repositories: Providing a safe haven for your data and acting as a springboard for further research // Journal of Proteomics. 2010. pp. 1-11.
188. W Vogel K. h zip. Developing assays for kinase drug discovery where have the advances come from? // 2007.
189. Westlind-Johnsson A. Comparative analysis of CYP3A expression in human liver suggests only a minor role for CYP3A5 in drug metabolism // Drug Metabolism and Disposition. 2003. T. 31. No. >6. pp. 755-761.
190. Wheeler D.L. h zip. Database resources of the National Center for Biotechnology Information. //Nucleic acids research. 2007. T. 35. No. Database issue. C. D5-12.
191. Whibley C., Pharoah P.D.P., Hollstein M. p53 polymorphisms: cancer implications. //Nature reviews. Cancer. 2009. T. 9. No. 2. P. 95-107.
192. Wilkins M.R. h/ip. From Proteins to Proteomes: Large Scale Protein Identification by Two-Dimensional Electrophoresis and Amino Acid Analysis // Bio/Technology. 1996. T. 14. No. 1. P. 61-65.
193. Wu C.H. hap. The Universal Protein Resource (UniProt): an expanding universe of protein information. // Nucleic acids research. 2006. T. 34. No. Database issue. C. D187-91.
194. Yates J R., Eng J. K., McCormack A. L. Mining Genomes: Correlating Tandem Mass Spectra of Modified and Unmodified Peptides to Sequences in Nucleotide Databases // Analytical Chemistry. 1995. T. 67. No. 18. P. 3202-3210.
195. Yip Y.L. h Annotating single amino acid polymorphisms in the UniProt/Swiss-Prot knowledgebase. // Human mutation. 2008. T. 29. No. 3. P. 3616.
196. Zanger U.M. hap. Polymorphic CYP2B6: molecular mechanisms and emerging clinical significance. //Pharmacogenomics. 2007. T. 8. No. 7. P. 743-59.
197. Zgoda V.G. h £p. Proteomics of mouse liver microsomes: performance of different protein separation workflows for LC-MS/MS. // Proteomics. 2009. T. 9. No. 16. P. 4102-5.
198. Zhou H. h ap. Quantitative proteome analysis by solid-phase isotope tagging and mass spectrometry. //Nature biotechnology. 2002. T. 20. No. 5. P. 512-5.
199. Zubarev R.A., Zubarev A.R., Savitski M.M. Electron capture/transfer versus collisionally activated/induced dissociations: solo or duet? // Journal of the American Society for Mass Spectrometry. 2008. T. 19. No. 6. P. 753-61.
Please note that the scientific texts presented above are posted for informational purposes only and were obtained through original dissertation text recognition (OCR). Therefore, they may contain errors associated with imperfect recognition algorithms. There are no such errors in the PDF files of dissertations and abstracts that we deliver.
Heading
2
2
Isolation and purification of proteins is carried out in stages.
1. Homogenization- this is the careful grinding of objects of biochemical research to a homogeneous, that is, homogeneous state, that is, proteins undergo thorough disintegration up to the destruction of the cell wall.
In this case they use:
A) Warring type knife homogenizers;
b) Potter-Elweheim pestle homogenizers;
V) ball and roller mills - for denser objects;
G) the method of alternating freezing and thawing, in which the rupture of the cell wall occurs under the influence of ice crystals;
d)“nitrogen bomb” method - under high pressure, cells are saturated with nitrogen, then the pressure is sharply released, nitrogen gas is released, which seems to explode the cell from the inside;
e) Ultrasound, various press methods, digestion of cell walls with enzymes. In most cases, homogenization generates heat, and many proteins can be inactivated, so all procedures are carried out in cold rooms at t 0 or the raw materials are cooled with ice. At the same time, the volume and time of cell destruction and working pressure are carefully controlled. The ideal homogenizate is one that can undergo further extraction.
2. Protein extraction, that is, their transfer to a dissolved state; Most often, extraction is carried out together with grinding at the same time.
Extraction is carried out:
A) dissolving in 8-10% salt solutions;
b) using buffer solutions with a pH from acidic to slightly alkaline (borate, phosphate, citrate, tris buffer: a mixture of trisaminomethane with NH2 – CH3 + HCl;
V) precipitation of proteins with organic solvents (ethanol, methanol, butanol, acetone and their combinations), in which case the breakdown of protein-lipid and protein-protein components occurs, that is, the destruction of BSP.
3. Purification and fractionation of proteins. After extraction, the mixture is separated or fractionated into individual proteins and their further purification:
a) salting out is the process of protein precipitation with neutral salt solutions of alkali and alkaline earth metals.
Salting out mechanism– added anions and cations destroy the hydrated protein shell of proteins, which is one of the stability factors of protein solutions. The most commonly used solutions are Na and ammonium sulfates. Many proteins differ in the size of their hydration shell and the amount of charge they have. Each protein has its own salting out zone. After removal of the salting out agent, the protein retains its biological activity and physicochemical properties. In clinical practice, the salting-out method is used to separate globulins (a precipitate forms when a 50% solution of ammonium sulfate (NH 4)2SO 4 is added) and albumins (a precipitate forms when a 100% solution of ammonium sulfate (NH 4) 2SO 4 is added).
The amount of salting out is influenced by:
1) nature and concentration of salt;
2) pH environment;
3) temperature.
The main role is played by the valence of the ions. Therefore, the effect of the salt is assessed by the ionic strength of the solution μ:
, that is, the ionic strength of the solution (μ) is equal to the product of ½ the concentration of each ion (C) by the square of its valency (V).
The Kohn method is a variation of salting out. At the same time, extraction and precipitation of components occurs. By successively changing the temperature (usually low t o –0+8 o C), the pH of the solution and concentrated ethanol, up to 18 protein fractions are sequentially isolated from the blood plasma.
Kohn method used in pharmaceutical production for the production of blood substitutes;
b) chromatography methods. The founder of the development of chromatographic methods of analysis is considered to be the Russian scientist Mikhail Tsvet (1903). Currently, there are many varieties of it. The method is based on the ability of substances to be specifically adsorbed on an adsorbent enclosed in a column or placed on any carrier. In this case, the analyzed substances are separated and concentrated in a strictly defined adsorbent layer. Appropriate eluents (solvents) are then passed through the column, which weaken the adsorption forces and wash the adsorbed substances out of the column. Substances are collected in a fraction collector.
Fundamental in chromatography is distribution coefficient, which is equal to the ratio of the concentration of a substance in mobile phase to the concentration of a substance in stationary phase(or stationary phase).
Stationary phase– can be solid or liquid or a mixture of solid and liquid.
Mobile phase- liquid or gaseous, it flows along or is passed through a stationary one.
Depending on the type of stationary and mobile phase, there are various modifications of chromatographic analysis.
Adsorption– is based on different degrees of adsorption of proteins by the adsorbent and their solubility in the corresponding solvent.
The adsorbents used are silicic acid, Al 2 O 3, CaCO 3, MgO, charcoal. The adsorbent in the form of a suspension with a solvent (usually a buffer solution) is packaged in a column (a glass vertical tube). The sample is applied to the column, then a solvent or mixture of solvents is passed through it.

The separation is based on the fact that substances with higher K distribution. (B), move along the column at greater speed. Fractions are collected using a fraction collector.
Partition chromatography– is based on the distribution of a mixture of proteins between two liquid phases. Separation can occur on special chromatographic paper, as well as in columns, like in adsorption columns. The solid phase in this case serves only as a support for the liquid stationary phase. Chromatographic paper has the property of trapping water between its cellulose fibers. This water is the stationary phase. When a non-aqueous solvent (mobile phase) moves through the paper under the action of capillary forces, the molecules of the substance deposited on the paper are distributed between the two phases in accordance with their distribution coefficient. The higher the solubility of a substance in the mobile phase, the further it will move along the paper along with the solvent.
In the case of distribution chromatography on a column, the carriers are cellulose, starch, silica gel, etc., the stationary phase is water. When applied to a column, mixtures of substances move along the column at different speeds, taking into account Kraspr.
Rf for each connection under standard conditions is a constant value.
Ion exchange chromatography is based on the attraction of oppositely charged particles. For this, various ion exchange resins are used: cation exchange resins - contain negatively charged groups - sulfonated styrene and CMC, which attract positively charged ions of the substances under study. They are also called acid ion exchangers.
Anion exchange resins, or basic ion exchangers, contain positively charged groups that attract negatively charged protein molecules
Trimethylaminostyrene is a derivative of styrene and cellulose.
Depending on the q of proteins being separated, appropriate ion exchangers are used, with which certain proteins interact, while others freely exit the column. Proteins “precipitated” on the column are removed using more concentrated salt solutions or changing the pH of the eluent.
Affinity chromatography (or affinity chromatography) is based on the principle of selective interaction of proteins or other macromolecules with specific substances immobilized on carriers - ligands (this can be a coenzyme if an enzyme, antibody, antigen, etc. are isolated. Due to the high specificity of proteins, it is attached to the immobilized ligands only one protein from the mixture is washed away with buffer mixtures with changed pH or changed ionic strength.
The advantage is the ability to single-step isolate a given substance of high purity.
The gel filtration method or molecular sieve method is a type of permeation chromatography.
The separation of molecules by size and shape is based on the molecular sieve properties that many porous materials have, such as organic polymers, which have a three-dimensional network structure that gives them the properties of gels. Gel filtration is the separation of substances using gels based on differences in the size of molecules (Sepharose, Sephadex, Sephacryl, biogels, etc.). Under the influence of epichlorohydrin, the polysaccharide chains of dextran (synthesized by microorganisms) are cross-linked into a network structure, becoming insoluble in water, but retaining high affinity for it. Due to this hydrophilicity, the resulting grains (called Sephadex) swell greatly to form a gel that fills the column. The method is based on the fact that large molecules do not penetrate into the internal aqueous phase, and smaller molecules first penetrate into the pores of the “sieve”, as if stuck in them, and therefore move at a lower speed. Accordingly, proteins with a larger Mr are the first to arrive at the receiver. Recently, porous glass granules are increasingly used as a molecular sieve in penetrating chromatography.
The electrophoretic method in biochemistry is based on the difference in the speed of movement of molecules in an electric field (amino acids, peptides, proteins, nucleic acids).
The difference in speed depends on:
1. from q of the molecule: the greater the total q, the greater the mobility of molecules. The value of q depends on pH;
2. on the size of the molecules: the larger the molecules, the less their mobility. This is due to an increase in frictional forces and electrostatic interactions of large molecules with the environment;
3. on the shape of the molecules: molecules of the same size but different shapes, for example, protein fibrils and globules have different speeds. This is due to differences in frictional forces and electrostatic interaction.
Types of electrophoresis
a) Isoelectric focusing. The separation occurs on a vertical column in degrees. both pH and voltage. With the help of special ampholyte carriers, hail is established in the column. pH from 0 to 14. A mixture of substances is placed in the column, and an electric current is connected. Each of the components moves to that part of the column where the pH value corresponds to its isoelectric point and stops there, that is, focuses.
Advantage: separation, purification and identification of proteins occurs in one step. The method has high resolution (0.02 pI).
b) Isotachophoresis is electrophoresis on supporting media. After turning on the electric current, ions with the highest mobility move to the corresponding electrode first, those with the lowest mobility are the last, and those with intermediate mobility are located in the middle.
c) Disc electrophoresis - the device consists of two vessels with a buffer - upper and lower, connected by vertical tubes containing a multi-porous gel. As ionized particles move under the influence of electric current. Higher porosity is in the upper part of the gel.
d) Immunoelectrophoresis - a method combining electrophoresis with immunodiffusion (for the detection of antigens in complex physiological mixtures). A mixture of antigens and a mixture of antibodies are placed perpendicular to each other on a special carrier. When the electric current is turned on, they are separated into individual substances and diffuse on the gel carrier. At the point where the antigen meets the corresponding antibody, a specific precipitation reaction occurs in the shape of an arc. The number of arcs formed corresponds to the number of antigens.
Methods for determining Mr proteins
For a large number of proteins, the chemical composition and amino acid sequence have not been established (1010–1012 proteins), therefore Mr. is determined for such proteins. In this case, various methods are used.
a) Sedimentation method - determination of Mr is carried out in special centrifuges (the first centrifuge was proposed by the Swedish biochemist Svedberg), in which it is possible to create a centrifugal acceleration that is 200 thousand or more times the acceleration of gravity. Mr is determined by V sedimentation of molecules. As molecules move from the center to the periphery, a sharp protein-solvent boundary is formed. The sedimentation rate is expressed through the sedimentation constant (S):
where V is the speed of movement of the protein-solvent boundary (cm/s);
– angular velocity of the rotor (rad/s);
– distance from the center of the rotor to the middle of the cell with the protein solution (cm).
The value of the sedimentation constant S, which is equal to 110–13 C, is conventionally taken as 1 and is called 1 Svedberg (S). S for proteins ranges from 1-50 S, sometimes up to 100 S.
Mr of proteins is determined by the Svedberg equation:
where R is the universal gas constant;
T – absolute temperature in Kelvin;
S – sedimentation constant;
D – diffusion coefficient;
– solvent density;
V – partial specific volume of gas.
This method is expensive due to the equipment used.
Simpler and cheaper:
b) Gel filtration in a thin layer of Sephadex.
The protein path length (in mm) is a logarithmic function of Mr.
X – Mr of the desired protein on the calibration graph.
c) Disc electrophoresis in a polyacrylamide layer - there is also a relationship between the logarithm Mr of calibration proteins and their path length.
Methods for determining protein homogeneity
The purity of the isolated protein is determined by:
- ultracentrifugation;
- disk electrophoresis method;
- various immunochemical methods;
- determination of protein solubility (Northrop's method) is based on the phase rule, according to which the solubility of a pure substance under given experimental conditions depends only on temperature, but does not depend on the concentration of the substance in the solid phase.
If the protein is homogeneous, then the graph shows one inflection (a), if there are protein impurities (b, c), then we get several inflections of the saturation curve. All proteins have their own individual solubility curves.
Issues covered:Methods for isolating organelles and membranes from tissues and cells.
Stages of subcellular fractionation: extraction,
homogenization and centrifugation, their features.
Methods for separation and purification of subcellular components.
Isolation of membrane particles.
Identification of membrane fractions, criteria for their purification.
Monitoring the presence of impurities using light and
electron microscopy, lipid composition analysis or
determining the activity of marker enzymes.
Determination of protein composition in isolated membranes
factions. Determination of marker enzyme activity
a certain type of isolated membrane fraction. Obtaining individual cellular components makes it possible to study
their biochemistry and functional features. For example, you can create
a cell-free system for ribosomes that will synthesize protein
according to the messenger RNA specified by the experimenter. Selected
Mitochondria under selected conditions can carry out ATP synthesis, at
isolated chromatin with the participation of appropriate enzymes can
RNA synthesis occurs, etc.
Recently, cell-free systems have been used to recreate
cellular supramolecular structures. So, using purified
yolk granules, extracts of the cytoplasm of amphibian eggs or marine eggs
hedgehogs, you can get nuclei with a nuclear envelope from the one introduced into this
cell-free system of foreign DNA (for example, bacteriophage DNA).
Such DNA binds to gaston proteins, which are found in abundance in
in such an extract, chromatin (deoxyribonucleoprotein) is formed,
which is covered with a double membrane shell, bearing even
nuclear pores. Such model systems help to study subtle,
intimate processes, for example transport of macromolecules from the cytoplasm to
core, and vice versa. In cytoplasmic extracts of amphibian eggs and
In echinoderms, such nuclei can periodically divide by mitosis. These
models have made a huge contribution to deciphering the nature of regulation
cell cycle. To isolate cellular organelles,
the test sample is crushed and
then homogenized in a buffered medium with
using a Potter-Elvegem homogenizer
(Teflon pestle rotating in glass
cylinder). This is a relatively gentle method that
especially preferable for isolating labile
molecules and ultrastructures. Other destruction techniques
cells include enzymatic lysis that destroys
cell walls, or mechanical destruction
frozen tissue (by grinding or using
rotating knives; under great pressure;
osmotic shock; multiple alternation
freezing and thawing). To isolate intact organelles, it is important that the environment in which
homogenization is carried out, was isotonic, i.e.
the osmotic pressure of the buffer must correspond to the pressure
inside the cell. If the solution is hypotonic, the organelles will
"absorb" additional water and burst, and in
In hypertonic solutions, on the contrary, they shrink.
Homogenization is followed by filtration to remove
intact cells and connective tissues. Actually
fractionation of cellular organelles is carried out using
differential centrifugation, i.e. centrifugation
at different rotor speeds. At the same time, stepwise
increase in centrifugal force (which is usually expressed
a multiple of the normal acceleration of gravity g
= 9.81 m/s2) leads to sequential deposition of various
organelles, i.e. their division according to density and
size. One of the main ways to isolate cellular structures is
differential (separation) centrifugation. Its principle
application is that the settling time of particles in the homogenate depends on their
size and density: the larger the particle or the heavier it is, the faster
it will settle to the bottom of the test tube. To speed up the settling process, vary
accelerations created by a centrifuge.
During centrifugation, the nuclei will settle first and at low accelerations.
and undestroyed cells, at 15-30 thousand g large particles will settle,
macrosomes consisting of mitochondria, small plastids, peroxisomes,
lysosomes, etc., at 50 thousand g microsomes, fragments of the vacuolar
cell systems.
When repeated fractional centrifugation of these mixed subfractions
pure fractions can be obtained. Thus, when dividing the macrosomal
subfractions are obtained separately: mitochondria, lysosomes, and peroxisomes. At
by separating microsomes, it is possible to obtain a fraction of the membranes of the Golgi apparatus,
fragments of the plasma membrane, vacuoles, granular reticulum. IN
in cases of finer separation of fractions, centrifugation is used
sucrose density gradient, which allows for good separation of components,
even slightly different from each other in specific gravity. Isolation of cellular organelles is usually carried out at low
temperatures (0-5°C) in order to reduce the degree
degradation of the material due to reactions catalyzed
enzymes; the latter are released during the destruction process
fabrics. The addition of thiols and chelating agents is necessary for
protection of functional SH groups from oxidation.
Before the isolated fractions are analyzed by biochemical
methods, it is necessary to check them for purity using
electron microscope.
Obtaining individual cellular components makes it possible
study their biochemistry and functional features. It's possible
create a cell-free system for ribosomes that will
synthesize protein as specified by the experimenter
messenger RNA. Isolated mitochondria in selected
conditions can carry out ATP synthesis on isolated chromatin
with the participation of appropriate enzymes can occur
RNA synthesis, etc. Basics of the centrifugation method
Particles in solution settle out (sedimentation),
when their density is higher than the density of the solution, or
float (flotation) when their density is lower
solution density. The greater the difference in
density, the faster the particle distribution occurs.
When the densities of particles and solution are the same
(isopycnic conditions), particles remain
motionless. For small differences in density
particles can only be separated in a centrifuge,
which creates centrifugal force many times
exceeding the force of gravity. relationship between density and sedimentation coefficient for
various particles in a cesium chloride (CsCI) solution. The particle sedimentation rate (ν) depends on the angular
speed (ω), effective rotor radius reff (distance from
rotation axis) and sedimentation properties of particles.
Sedimentation properties of the particle
characterized by sedimentation coefficient S and
expressed in Svedberg units (1S = 10-13s).
The value of S can vary widely. For
comparison of sedimentation coefficients in different media
they are usually adjusted for the density and viscosity of water when
20oC (S20w).
The sedimentation coefficient depends on the molecular weight
(M) particles, their shapes (friction coefficient f),
partial specific volume ΰ (value, reciprocal
particle density).
Density Gradient Centrifugation
Macromolecules or organelles that vary slightly in size or density
can be separated by density gradient centrifugation. For these purposes, two
method.
In zonal centrifugation, the sample to be analyzed (for example, proteins or cells)
layered in a thin layer on top of the buffer solution. During the centrifugation process, particles
pass through the solution, since their density is higher than the density of the solution. Travel speed
depends on the mass and shape of the particles (see formulas in diagram A). Centrifugation is stopped
before the particles reach the bottom of the centrifuge tube. Then the bottom is pierced and
a number of fractions containing different particles are collected. Stability of the density gradient in
centrifugation process is achieved by using solutions of carbohydrates or colloidal
silica gel, the concentration of which increases from the surface to the bottom of the test tube. Density gradient
prevents the formation of convection currents that reduce the quality of separation.
With isopycnic centrifugation, the sample (such as DNA, RNA or viruses) is evenly
distributed throughout the entire volume of the solution (usually CsCI). In this case the division continues
significantly longer than with zonal centrifugation. The density gradient is created in
centrifugation process due to sedimentation and diffusion. Over time, every particle
falls into the region corresponding to its own buoyant density. Centrifugation
stop when equilibrium is established. The resulting fractions were analyzed using
suitable measuring technology. Marker molecules
During the fractionation process it is important
control the purity of fractions. Presence
in a certain faction of one or another
organelles and the presence of other components
determined using marker molecules.
These are usually organelle-specific
enzymes (marker enzymes).
Distribution of marker enzymes in the cell
reflects the localization in it
corresponding catalytic reactions. Functions and composition of biomembranes
The most important membranes in animal cells
are the plasma membrane, internal and
outer nuclear membrane, membrane
endoplasmic reticulum and Golgi apparatus
, internal and external mitochondrial
membranes. Lysosomes, peroxisomes, various
vesicles are also separated from the cytoplasm by membranes
. Plant cells contain additional membranes
chloroplasts, leucoplasts and vacuoles. All
membranes are polar, i.e. there is a difference in
compositions internal and external in relation to
cytoplasm layers. Biomembranes and their components perform the following functions:
1. Restriction and isolation of cells and organelles. Separation of cells from intercellular
environment is provided by a plasma membrane that protects cells from
mechanical and chemical influences. The plasma membrane provides
also maintaining the difference in concentrations of metabolites and inorganic ions between
intracellular and external environment.
2. The controlled transport of metabolites and ions determines the internal environment, which
essential for homeostasis, i.e. maintaining a constant concentration of metabolites and
inorganic ions, and other physiological parameters. Adjustable and
selective transport of metabolites and inorganic ions through pores and
through carriers becomes possible due to the separation of cells and
organelles using membrane systems.
3. Perception of extracellular signals and their transmission into the cell, as well as initiation
signals.
4. Enzymatic catalysis. In membranes at the interface between the lipid and aqueous phases
enzymes are localized. This is where reactions with non-polar substances occur
substrates. Examples include lipid biosynthesis and metabolism of nonpolar
xenobiotics. The most important energy reactions are localized in membranes
metabolism, such as oxidative phosphorylation (respiratory chain) and photosynthesis.
5. Contact interaction with the intercellular matrix and interaction with others
cells during cell fusion and tissue formation.
6. Anchoring of the cytoskeleton, ensuring the maintenance of the shape of cells and organelles
and cell motility. After homogenizing the sample, centrifuging the homogenate with
separate fractions containing
cell nuclei, mitochondria and other organelles, as well as
supernatant liquid containing soluble substances
proteins of the cell cytosol.
Membrane Associated Protein Extraction and Degradation
oligomeric proteins into protomers
If the desired protein is tightly bound to any structures
cells, it must be transferred into solution.
To break hydrophobic interactions between proteins
and membrane lipids, detergents are added to the solution: More often
Triton X-100 or sodium dodecyl sulfate are used.
When exposed to detergents, hydrophobic properties are usually destroyed.
interactions between protomers in oligomeric proteins Removing non-protein substances from a solution
Nucleic acids, lipids and others
non-protein substances can be removed from solution using their special physicochemical
properties. So, lipids are easy
are deleted
from
solution
adding
organic
solvents,
For example
acetone. However, the impact should be
short-term. since acetone causes
denaturation of some proteins. Nucleic
acids are precipitated by adding to the solution
streptomycin. Isolation of membrane lipids is carried out immediately after obtaining the membrane
fraction that must be protected from the action of proteo- and lipolytic
enzymes, autoxidation.
Typically, all procedures are carried out at low temperatures, maintaining certain
pH and ionic strength values. For lipid extraction, a mixture of chloroform-
methanol For the simultaneous extraction of proteins and lipids from the shadows of red blood cells
extracted with a butanol-water mixture. In this case, most of the proteins are transferred to
aqueous, and lipid into the butanol layer.
Quantitative analysis of complex mixtures of phospholipids is carried out
chromatographic methods. Mainly used for medicinal purposes
column chromatography. Successful for microanalytical studies
Thin layer chromatography is used to separate
almost all classes of lipids, localize and identify them when
using special reagents.
According to their elution ability, solvents are located in the following order:
in ascending order petroleum ether, cyclohexane, carbon tetrachloride,
toluene, benzene, chloroform, diethyl ether, ethyl acetate, acetone, n-propanol,
ethanol, methanol, water. After passing through the solvents, the plate is dried on
air and identify lipids using specific staining
reagents. For the quantitative determination of phospholipids separated
thin layer chromatography, using spectrophotometric methods. Membrane research is largely
are at least based on two main
methodological techniques: this is disassembly
native (i.e. natural) membrane on
its constituent elements and subsequent
full or partial assembly of artificial
membranes using all or
parts of the original membrane components.
As applied to membranes, these techniques
called "solubilization" and
"reconstruction". For solubilization it is better to use detergents with
low CMC, since such detergents are lighter
are embedded in the membrane and cause it faster
decomposition into mixed micelles. In this capacity
ionic detergents are most effective.
As parameters characterizing the ability
detergents to micellization, usually
use critical concentration
micelle formation (MCM) and aggregation number. KKM –
this is the concentration at which the detergent begins to
form micelles. Before that he is in the water
in monomeric form in true state
solution. The aggregation number shows how many
detergent molecules per micelle. There are four main removal methods most commonly used
detergent: dialysis, gel filtration, high dilution
solubilizate and detergent adsorption on hydrophobic polymers.
A faster method is based on removing the detergent using
gel filtration, when the solubilisate is passed through an inert
a gel whose pore size is large enough to hold
detergent molecules, but small compared to those formed
membrane particles that pass freely between
gel granules.
The detergent can be removed from the membrane with maximum completeness
by its adsorption on hydrophobic polymers. This method
particularly good for removing residual detergent from
already formed membrane particles. However, to remove
detergent from the initial solubilizate, it is of little use, since it
In the initial stages of reconstruction, detergent removal may
accompanied by the adsorption of significant amounts of protein and lipid
on polymer. Therefore, this method is usually used in combination with
by other means at the final stage of detergent removal.