Median- this is the value of the attribute that divides the ranked series of the distribution into two equal parts - with attribute values less than the median and with attribute values greater than the median. To find the median, you need to find the value of the attribute that is in the middle of the ordered series.
View the solution to the problem of finding the mode and median You can
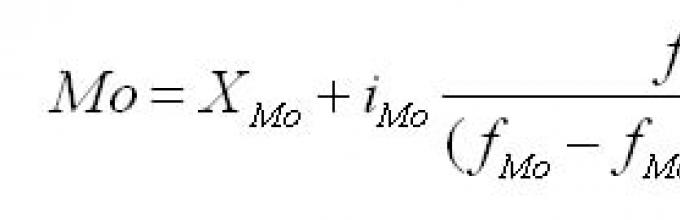
In ranked series, ungrouped data for finding the median boil down to searching serial number medians. The median can be calculated using the following formula:
where Xm is the lower limit of the median interval;
im - median interval;
Sme is the sum of observations that were accumulated before the start of the median interval;
fme is the number of observations in the median interval.
Properties of the median
- The median does not depend on those attribute values that are located on either side of it.
- Analytical operations with the median are very limited, so when combining two distributions with known medians, it is impossible to predict in advance the value of the median of the new distribution.
- The median has property of minimality. Its essence lies in the fact that the sum of the absolute deviations of x values from the median is the minimum value compared to the deviation of X from any other value
Graphical definition of median
For determining medians by graphical method They use accumulated frequencies from which a cumulative curve is constructed. The vertices of the ordinates corresponding to the accumulated frequencies are connected by straight segments. By dividing the last ordinate in half, which corresponds to the total sum of frequencies, and drawing a perpendicular intersection with the cumulative curve to it, the ordinate of the desired median value is found.
Definition of fashion in statistics
Fashion - the value of the attribute, which has the highest frequency in the statistical distribution series.
Definition of fashion is produced in different ways, and this depends on whether the varying characteristic is presented in the form of a discrete or interval series.
Finding fashion and median is done by simply looking at the frequency column. In this column they find greatest number, characterizing the highest frequency. It corresponds to a certain value of the attribute, which is the mode. In an interval variation series, the mode is approximately considered to be the central variant of the interval with the highest frequency. In such a distribution series the mode is calculated by the formula:

where XMo is the lower limit of the modal interval;
imo - modal interval;
fм0, fм0-1, fм0+1 - frequencies in the modal, previous and following modal intervals.
The modal interval is determined by the highest frequency.
Fashion is widely used in statistical practice when analyzing consumer demand, recording prices, etc.
Relationships between arithmetic mean, median and mode
For a unimodal symmetric series, the distributions , median and mode coincide. For asymmetric distributions they are not the same.
K. Pearson based alignment various types curves determined that for moderately asymmetric distributions the following approximate relationships between the arithmetic mean, median and mode are valid:

Slepnev Pavel
In the 7th grade algebra course, the textbook edited by Telyakovsky offers material from statistics “The Arithmetic Mean, Range and Mode.” The student in his work offers examples for considering this topic that his classmates suggested.
Download:
Preview:
MU Department of Education MO "Tarbagatai district"
MBOU "Zavodskaya OOSH"
"Arithmetic mean, range and mode"
Completed by: Slepnev Pavel, 7th grade student
Scientific adviser:
Ulakhanova Marina Rodionovna,
mathematic teacher
year 2012
Introduction Page 3
Main part Page 4-9
Theory of the issue pp. 4-6
Mini-projects pp. 7-9
Conclusion Page 9
References Page 10
Introduction
Relevance
In that academic year We started studying two subjects: algebra and geometry. When studying algebra, some things are familiar to me from the 5th and 6th grade courses, some we study more thoroughly and in depth, we learn a lot of new things. What’s new to me when studying algebra is getting acquainted with some statistical characteristics: range and mode. We have already encountered the arithmetic mean earlier. What also turned out to be interesting is that these characteristics are used not only in mathematics lessons, but also in life, in practice (in production, in agriculture, in sports, etc.).
Formulation of the problem
When we were solving problems for this point in class, the idea arose to create the problems ourselves and prepare presentations for them, that is, to sort of start creating our own problem book. Everyone comes up with a problem, makes a presentation for it, as if everyone is working on their own mini-project, and in class we solve everything together and discuss it. If mistakes are made, we correct them. And at the end, publicly defend these mini-projects.
The purpose of my work: study statistics.
Objectives: begin developing a statistics problem book in the form of computer presentations.
Subject of research: statistics.
Object of study: statistical characteristics (arithmetic mean, range, mode).
Research methods:
- Studying literature on this topic.
- Data analysis.
- Use of Internet resources.
- Using Power Point.
- Summarizing the collected materials on this topic.
Main part.
Theory of the issue
While studying the section “Statistical characteristics” we became acquainted with the following concepts: arithmetic mean, range, mode. These characteristics are used in statistics. This science studies numbers separate groups population of the country and its regions, production and consumption of various types of products, transportation of goods and passengers by various modes of transport, Natural resources and so on.
“Statistics knows everything,” Ilf and Petrov asserted in their famous novel “The Twelve Chairs” and continued: “It is known how much food the average citizen of the republic eats per year... It is known how many hunters, ballerinas, machines, bicycles, monuments there are in the country, lighthouses and sewing machines... How much life, full of ardor, passions and thoughts, looks at us from statistical tables!..” This ironic description gives a fairly accurate idea of statistics (from the Latin status - state) - the science that studies, processes and analyzing quantitative data on a wide variety of mass phenomena in life.
Economic statistics studies changes in prices, supply and demand for goods, predicts the growth and decline of production and consumption.
Medical statistics studies the effectiveness of various drugs and treatment methods, the likelihood of a certain disease depending on age, gender, heredity, living conditions, bad habits, predicts the spread of epidemics.
Demographic statistics studies the birth rate, population size, and its composition (age, national, professional).
There are also financial, tax, biological, and meteorological statistics.
IN school course algebra we look at concepts and methods descriptive statistics, which deals with primary information processing and calculation of the most significant numerical characteristics. According to the English statistician R. Fisher: “Statistics can be characterized as the science of reducing and analyzing material obtained from observations.” The entire set of numerical data obtained in the sample can (conditionally) be replaced by several numerical parameters, some of which we have already considered in lessons - arithmetic mean, range, mode. The results of statistical studies are widely used for practical and scientific conclusions, so it is important to be able to determine these statistical characteristics.
Statistical characteristics are found everywhere these days. For example, the population census. Thanks to this census, the state will know how much money is needed for the construction of housing, schools, hospitals, how many people need housing, how many children there are in the family, the number of unemployed, salary levels, etc. The results of this census will be compared with the last one, they will see whether the country has improved during this time or the situation has become worse, it will be possible to compare the data with the results in other countries. In industry great importance has fashion. For example, a product that is in great demand will always be sold, and factories will have a lot of money. And there are many such examples.
The results of statistical studies are widely used for practical and scientific conclusions.
Definition 1. The arithmetic mean of a series of numbers is the quotient of dividing the sum of these numbers by the number of terms.
Example: When studying study load We selected a group of 12 7th grade students. They were asked to note on a certain day the time (in minutes) spent on completing homework in algebra. We received the following data:
23, 18, 25, 20, 25, 25, 32, 37, 34, 26, 34, 25. With this series of data, you can determine how many minutes, on average, students spent on algebra homework. To do this, you need to add the indicated 12 numbers and divide the resulting sum
at 12: ==27.
The resulting number 27 is called the arithmetic mean of the series of numbers under consideration.
The arithmetic mean is an important characteristic of a series of numbers, but sometimes it is useful to consider others average.
Definition 2. The mode of a series of numbers is the number that appears in a given series more often than others.
Example: When analyzing information about the time spent by students on algebra homework, we may be interested not only in the arithmetic mean and the range of the obtained series of data, but also in other indicators. For example, it is interesting to know what time consumption is typical for a selected group of students, i.e. which number occurs most often in the data series. It is easy to see that in our example this number is 25. They say that the number 25 is the mode of the series under consideration.
A series of numbers may have more than one mode, or may not have a mode at all. For example, in the series of numbers 47, 46, 50, 47, 52, 49, 45, 43, 54, 52, 47, 52, two modes are the numbers 47 and 52, since each of them occurs three times in the series, and other numbers - less than three times.
There is no mode in the number series 69, 68, 66, 70, 67, 62, 71, 74, 63, 73, 72.
The mode of a data series is usually found when one wants to identify some typical indicator. Mode is an indicator that is widely used in statistics. One of the most common uses of fashion is to study demand. For example, when deciding what weight packs to pack butter in, what flights to open, etc., demand is first studied and fashion is identified - the most common order.
However, finding the arithmetic mean or mode does not always allow one to draw reliable conclusions based on statistical data. if we have a series of data, then in order to make valid conclusions and reliable forecasts based on them, in addition to the average values, we must also indicate how much the data used differ from each other. One statistical measure of the difference or dispersion of data is range.
Definition 3. The range of a series of numbers is the difference between the largest and smallest of these numbers.
Example: In the example above, we found that, on average, students spent 27 minutes on algebra homework. However, analysis of the data series shows that the time spent by some students differs significantly from 27 minutes, i.e. from the arithmetic mean. The highest consumption is 37 minutes, and the lowest is 18 minutes. The difference between the highest and lowest time consumption is 19 minutes. In this case, another statistical characteristic is considered - scope. The range of a series is found when one wants to determine how large the spread of data in a series is.
Mini projects
And now I would like to present the results of our work: mini-projects for creating a statistics problem book.
I work at the Super-auto showroom as the chief manager of the sales department. Our salon provided cars to participate in the all-wheel drive game. Last year at the exhibition and sale our cars were a success! The sales results are as follows:
Cars sold on the first day | Cars sold on the second day | Cars sold on the third day | Cars sold on the fourth day | Cars sold on the fifth day |
The sales department needs to summarize the results of the exhibition:
- How many cars were sold per day on average?
- What is the spread in the number of cars during the exhibition and sale period?
- How many cars were most often sold per day?
Answer: on average, 150 cars were sold per day, the range of the number of cars sold was 150, most often 100 cars were sold per day.
I, Anastasia Volochkova, was invited to the jury for the final of the Ice and Fire competition. The competition took place in the city of St. Petersburg. Three pairs of the strongest skaters reached the finals: 1 pair. Batueva Alina and Khlebodarov Kirill, 2nd couple. Selyanskaya Yulia and Kushnarev Pavel, 3 pair. Zaigraeva Anastasia and Afanasyev Dmitry. Jury: Anastasia Volochkova, Elena Malysheva, Alexey Dalmatov. The jury gave the following scores:
Find the arithmetic mean, range and mode in the series of estimates for each pair.
Answer:
Results | Average arithmetic | Scope | Fashion |
1 pair | 5.43 | ||
2 pair | 5.27 | ||
3 pair | 5.23 | No |
This year I visited St. Petersburg for a ballroom dancing competition. Three beautiful couples took part in the competition: Elena Sushentsova and Kirill Khlebodarov, Alina Batueva and Pavel Slepnev, Victoria Dzhaniashvili and Valery Tkachev.
The couples received the following scores for their performances:
Find the average estimate, range and mode.
Answer:
Couples | Average | Scope | Fashion |
№1 | 4,42 | ||
№2 | 4,37 | ||
№3 | 4,37 |
I am the director of the fashion clothing and accessories store “Fashion”. The store makes a good profit. Sales figures for last year:
915t.r. | 1 million 150 rub. | 1 million 980t.r. | 2 million 3t.r. | 2 million 950t.r. | 3 million 950t.r. | 3 million 100t.r. | 2 million 950t.r. | 3 million | 3 million 750t.r. | 2 million 950t.r. | 4 million 250t.r. |
For the first 2-3 months, the profit reached 2 million per month. Afterwards, the profit increased to 4 million. The most successful months were: December and May. In May, we mainly bought dresses for proms, and in December for New Year's celebrations.
Question to my chief accountant: what are the results of our work for the year?
Answer:
Average | RUB 2,745,000 |
Scope | RUB 4,158,500 |
Fashion | RUB 2,950,000 |
We organized a tuning workshop “Turbo”. During the first week of our work, we earned: on the first day - $120,000, on the second day - $350,000, on the third day - $99,000, on the fourth day - $120,000. Calculate what is our average income per day, what is the gap between the highest and lowest earnings and what amount is repeated most often?
Answer: arithmetic mean – $172,250, range – $251,000, mode – $120,000.
Conclusion
In conclusion, I want to say that I love this topic. Statistical characteristics are very convenient and can be used everywhere. In general, they compare, strive for progress and help to find out the opinion of the people. In the course of working on this topic, I became acquainted with the science of statistics, learned some concepts (arithmetic mean, range and mode) where this science can be applied, and expanded my knowledge in computer science. I think that our problems as examples for mastering these concepts will be useful to others! We will continue to get acquainted with this science and create our own problems!
So my journey into the world of mathematics, computer science and statistics has ended. But I think it's not the last. There is still a lot I want to know! As Galileo Galilei said: “Nature formulates its laws in the language of mathematics.” And I want to master this language!
Bibliography
- Bunimovich E.A., Bulychev V.A. « Probability and statistics in mathematics course secondary school", M.: Pedagogical University“First of September”, 2005
- Makarychev Yu.N., Mindyuk N.G., Neshkov K.I., Suvorova S.B. “Algebra, 7th grade”, M: “Prosveshcheniye”, 2009
- Makarychev Yu.N., Mindyuk N.G. « Algebra. Elements of statistics and probability theory”, grades 7 – 9. – M.: Education, 2005.
Review
The subject of the student's research is statistics.
The object of the study is statistical characteristics (arithmetic mean, range, mode).
The student studied scientific sources and Internet resources to become familiar with the theory of the issue.
The chosen topic is relevant for students who show interest in mathematics, computer science, and statistics. For his age, sufficient material was analyzed, data was selected, and generalized. The student has sufficient knowledge of ICT.
The work is completed in accordance with the requirements.
At the end of the study, a conclusion is drawn and a practical product is presented: presentations of problems in statistics. I am glad that a person is so passionate about mathematics.
Scientific supervisor: Ulakhanova MR,
mathematic teacher
Objectives: to give concepts, algorithms for finding the arithmetic mean and median, range and mode of a number of numbers, to show the significance of this topic in practical human activity; acquiring practical skills to perform these tasks; increasing the level of mathematical training required by the new standards.
- equip students with a system of knowledge on the topic “Determination of the probability of events, the arithmetic mean and median of a set of numbers”;
- develop skills in applying this knowledge when solving a variety of problems of varying complexity;
- prepare students for passing the State Examination Test;
- develop independent work skills.
During the classes
1. Theoretical part.
1). Finding the probability of events.
IN Everyday life, in practical and scientific activities, certain phenomena are often observed and certain experiments are carried out.
In the process of observation or experiment one encounters some random events, i.e., such events that may or may not happen. For example, getting heads or tails when tossing a coin, hitting a target or missing a shot, winning a sports team in a meeting with an opponent, losing or a draw - all these are random events.
Patterns random events studies a special branch of mathematics called probability theory. Probability theory methods are used in many fields of knowledge.
The origin of probability theory occurred in search of an answer to the question: how often does this or that event occur in a large series of tests occurring under the same conditions with random outcomes.
In order to assess the probability of an event of interest to us, it is necessary to conduct a large number of experiments or observations, and only after that can the probability of this event be determined.
For example, throwing a die. When throwing a die, the chances of each number from 1 to 6 appearing on its top face are the same. They say there are 6 equally possible outcomes experience with dice rolling: roll 1,2,3,4,5, and 6 points.
Outcomes in this experiment are considered equally possible if the chances of these outcomes are equal.
Outcomes in which some event occurs are called favorable outcomes for that event.
Definition: the ratio of the number of favorable outcomes N (A) of event A to the number of all equally possible outcomes N of this event is called the probability of event A.
Scheme for finding the probability of an event.
To find the probability of a random event A during a certain test, you should:
- find the number N of all equally possible outcomes of a given test;
- find the number N(A) of those favorable trial outcomes in which event A occurs;
- find the ratio N(A)/N; this is the probability of event A
For example: 1 . A box contains 10 red, 7 yellow and 3 blue balls. What is the probability that a ball taken at random will be yellow?
Solution. Equally possible outcomes - (10+7+3)=20
Favorable outcomes-7
2. There are 5 black balls in the box. What is the smallest number of white balls that must be placed in this box so that the probability of drawing a black ball out of the box at random is no more than 0.15?
Solution: Let x be white balls.
2) Determining and finding the arithmetic mean and median of a series of numbers.
Definition: the arithmetic mean of several numbers is a number equal to the ratio of the sum of these numbers to their number.
The arithmetic mean of a set of numbers x 1 , x 2 , x 3 , x 4 , x 5 is usually denoted as x.
For example, the arithmetic mean of five numbers will be written like this:
X = (x 1 +x 2 +x 3 +x 4 +x 5)/5
Example: find the student’s average grade in mathematics if over the past period he received: 3,4,4,5,3,2,4,3.
Solution: (3+4+4+5+3+2+4+3)/8=3.5
Definition: a median is a number that divides a set of numbers into two parts of equal numbers, so that on one side of this number all values are greater than the median, and on the other less. Instead of "median" you could say "middle".
Scheme for finding the median of a set of numbers:
To find the median of a set of numbers:
- arrange a number set (write in ascending order);
- simultaneously cross out the “largest” and “smallest” numbers this set numbers until one number or two numbers remain;
- if one number remains, then it is the median (for an odd set of numbers);
- if there are two numbers left, then the median will be the arithmetic mean of the two remaining numbers (for an even set of numbers).
The median is usually denoted by the letter M.
Example: find the median of a set of numbers: 9,3,1,5,7.
Solution: write the numbers in ascending order: 1,3,5,7,9.
Cross out 1 and 9, 3 and 7. The remaining number 5 is the median. M=5
Example: find the median of a set of numbers 2,3,3,5,7,10.
Solution: cross out 2 and 10, 3 and 7. To find M you need: (3+5)/2= 4. M=4
Determining and finding scope and mode.
Definition: The range of a series of numbers is the difference between the largest and smallest of these numbers.
The range of a series is found when one wants to determine how large the spread of data in a series is.
Definition: The mode of a series of numbers is the number that appears in a given series more often than others.
A series of numbers may have more than one mode, or may not have a mode at all.
Example: In a physical education lesson, 14 schoolchildren were high jumping, and the teacher was recording their results. The result was the following series of data (in cm):
125, 110, 130, 125, 120, 130, 140, 125, 110, 130, 120, 125, 120, 125.
Find the median, range and mode of measurement.
Solution: write down all measurement options in ascending order, separating groups of identical results with spaces:
110, 110, 120, 120, 120, 125, 125, 125, 125, 125, 130, 130, 130, 140.
The measurement range is 140-110=30.
125 - met the greatest number of times, i.e. 5 times; it is a mode of measurement.
2. Practical part.
1). Tasks for independent decision on probability theory.
1. For every 100 light bulbs, on average there are 4 defective ones. What is the probability that a light bulb taken at random will turn out to be working? Answer: 0.96.
2. On average, there are 8 defective CDs per 400 CDs. What is the probability that a CD taken at random will be good? Answer: 0.98.
3. 17 points out of 50 are colored blue, and 13 points out of the remaining ones are colored orange. What is the probability that a randomly selected point will be colored? Answer: 0.6.
4. One letter is randomly selected from the word “mathematics”. What is the probability that the selected letter occurs only once in this word? Answer: 0.3.
5. One letter is randomly selected from the word “certification”. What is the probability that the chosen letter will be the letter "a"? Answer: 0.2
6. Of the 30 ninth-graders, 4 chose an exam in physics, 12 in social studies, 8 in a foreign language, and the rest in literature. What is the probability that the selected student will take the literature exam. Answer: 0.2.
7. Test in mathematics consists of 15 problems: 4 problems in geometry, 2 problems in probability theory, the rest in algebra. The student made a mistake in one problem. What is the probability that a student made a mistake in an algebra problem? Answer: 0.6.
8. Out of 1000 cars produced in 2007-2009, 150 have a defective brake system. What is the probability of buying a faulty car? Answer: 0.15.
9. Participating in the rhythmic gymnastics competition are: 3 gymnasts from Russia, 3 gymnasts from Ukraine and 4 gymnasts from Belarus. The order of performance will be determined by drawing lots. Find the probability that a gymnast from Russia will compete first. Answer 0.3
10. There are 18 gymnasts performing at the rhythmic gymnastics championship, among them 3 gymnasts from Russia, 2 gymnasts from China. The order of performance is determined by drawing lots. Find the probability that a gymnast from either Russia or China will compete last? Answer: 5/18.
11. From a class of 12 boys and 8 girls, 1 person on duty is chosen by lot. What is the probability that it will be a boy? Answer: 0.6.
12. 2 coins are thrown at the same time. What is the probability of them landing on 2 heads? The answer is 0.25.
2)Problems on finding the arithmetic mean and median, range and mode of a set of numbers.
Milling crews spent on processing one part different time(in min.), presented as a data series: 40; 37; 35; 36; 32; 42; 32; 38; 32. How much does the median of this set differ from the arithmetic mean? Answer: 0.
5 apple tree seedlings were planted in the garden, the height of which in centimeters is as follows: 168, 13, 156, 165, 144. How much does the arithmetic mean of this set of numbers differ from its median? Answer: 3, 8
6 pear trees growing in the garden gave a harvest, the mass of which (in kg) for each of the trees is as follows: 29, 35, 26, 28, 32, 36. How much does the arithmetic mean of this set of numbers differ from its median? Answer: 0.5
The time the cashier served each of several store customers formed the following series of data: 2 minutes. 42 sec., 3 min. 2 sec., 3 imn. 7 sec., 2 min. 54 sec., 2 min. 48 sec. Find the mean and median of this data series. Answer: 2 min. 55 sec., 2 min. 54 sec.
The time between seven calls received by the taxi service formed the following series of data: 34 seconds, 45 seconds, 1 minute. 16 sec., 38 sec., 43 sec., 52 sec. Find the mean and median of this data series. Answer: 48 sec., 44 sec.
Literature : Mordkovich, A. G., I. M. Smirnova. Tutorial for educational institutions(basic level) - M.: Mnemosyne, 2009. - 164 p.
Studenetskaya V. N. Solving problems in statistics, combinatorics and probability theory, grades 7-9, Volgograd, Teacher, 2009. In addition to power averages in statistics, for the relative characterization of the value of a varying characteristic and the internal structure of distribution series, structural averages are used, which are mainly represented by.
Fashion fashion and median

- This is the most common variant of the series. Fashion is used, for example, in determining the size of clothes and shoes that are most in demand among buyers. The mode for a discrete series is the one with the highest frequency. When calculating the mode for an interval variation series, you must first determine the modal interval (based on the maximum frequency), and then the value of the modal value of the attribute using the formula: Median -
this is the value of the attribute that underlies the ranked series and divides this series into two equal parts. To determine the median in a discrete series if frequencies are available, first calculate the half-sum of frequencies , and then determine which value of the variant falls on it. (If the sorted series contains odd number
characteristics, then the median number is calculated using the formula:
M e = (n (number of features in total) + 1)/2,
in the case of an even number of features, the median will be equal to the average of the two features in the middle of the row). When calculating the median for interval variation series

First, determine the median interval within which the median is located, and then determine the value of the median using the formula: Example
. Find the mode and median.:
IN Solution in this example
the modal interval is within the age group of 25-30 years, since this interval accounts for the highest frequency (1054).
Let's calculate the magnitude of the mode:
This means that the modal age of students is 27 years. Let's calculate the median. The median interval is in age group

25-30 years, since within this interval there is an option that divides the population into two equal parts (Σf i /2 = 3462/2 = 1731). Next, we substitute the necessary numerical data into the formula and get the median value:
In addition to mode and median, indicators such as quartiles can be used, dividing the ranked series into 4 equal parts, deciles -10 parts and percentiles - into 100 parts.