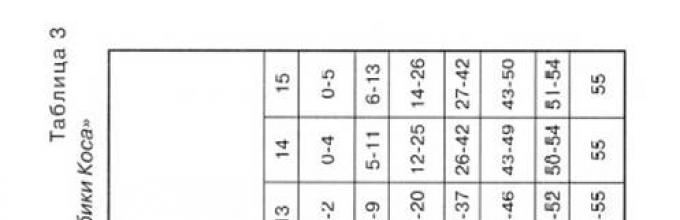
When performing tasks in the “Kos Cubes” test, the subject’s train of thought is, as it were, projected outward. Therefore, the experimenter has a rather rare opportunity not only to quantitatively assess the intellectual abilities being measured, but also to explore the qualitative features of the analytical and synthetic processes stimulated by the test. Using this opportunity, let us first characterize the mental process that takes place when solving “Kos Cubes”. This is necessary for a deeper understanding and interpretation of the results obtained.
“The pattern depicted on the card is perceived by the subject as an integral unity and must be mentally divided into several parts of equal size. In this case, the subject must realize that the number of these parts is equal to the number of available cubes. This is analytical problem subject"
The division of the pattern into separate parts corresponding to one cube can occur in different ways. However, if the subject has not performed such an analysis, then the folding of the pattern will proceed entirely by trial and error, or by finding similarities between individual parts of the pattern and individual cubes.
Let us assume that the correct analysis of the pattern has been carried out (for some subjects this is very characteristically manifested in behavior. They silently examine the pattern for a long time, then say: “So”). After this comes the stage of synthesis, which psychologically occurs differently in different subjects. Some subjects mentally plan almost the entire folding process and then work systematically, sequentially placing the cubes one after another, or from left to right in rows, or from top to bottom in columns, or from the center to the periphery, or by laying out identical or symmetrical parts of the pattern one after another. Moreover, in the overwhelming majority of cases, subjects in this group never “try on” the cubes, but turn them in their hand with the desired edge and immediately put them in place. Based on this external behavior, it can be assumed that the analysis and synthesis of the pattern here is already completed by the time folding begins; synthesis is ahead of folding.
In another group of subjects, a different external picture can be observed. The subjects also quickly and accurately put together the cubes, but not the whole pattern, but some part of it, more or less complete. After that, they think for some time and begin to fold another part of the pattern. In this group, the cubes are also not tried on, but are immediately placed with the desired edge. Thus, we are dealing with a thought process of the same internal structure as in the first group. The only difference is that in this case, the subjects analyze the pattern in pieces, and not completely.
In the third group of subjects, folding occurs in a fundamentally different way. The subjects take the cube in their hands and, turning it, try to find the similarity of one or another of its faces with any part of the pattern. Having thus placed the first cube, the subjects try on the second one in the same way, and so on. In this case, the following phenomenon occurs quite often: after turning one cube in his hands and, obviously, not guessing which side to put it on, the subject puts this cube aside and takes another, although he knows that all the cubes are the same. With this method of folding, the subjects apparently do not perform a preliminary analytical division of the pattern; synthetic processes are also absent, and they are replaced by the process of discriminative comparison. Moreover, the starting point for such a comparison is often not some part of the pattern, but the cube itself.
In worse cases, subjects turn the cube in their hands, place it completely incorrectly, and when asked by the experimenter whether it should be placed this way, they answer in the affirmative.
It is clear that during testing, the methods of adding cubes may change, but the predominance of “planning” thinking, based on developed operations of analysis and synthesis, is clearly visible to an experienced experimenter.”
Quantitative indicators characterize the level of development of non-verbal (practical, visual-effective) intelligence and analytical-synthetic abilities that underlie intellectual talent. The results obtained are interpreted depending on the scope and meaning of the indicator.
Scope of application
| Indicator value | Low | High |
| Medicine: identifying symptoms of certain neuropsychological disorders. | Possible organic disorders of the central nervous system, impaired visual-motor coordination, apraxia | |
| Education: assessing potential learning opportunities and intellectual development. | Difficulties in learning and developing other intellectual functions | Good opportunities for intellectual development, regardless of existing education, high level general learning ability |
| Career guidance and selection: assessment of professional capabilities and psychological suitability of specialists in certain technical and artistic professions. | Difficulties in performing constructive activities, psychological contraindications for engineers, designers, mechanics, machine operators, builders, designers, fashion designers, cutters, tailors, etc. | Possibility of successful implementation of constructive activities, good prerequisites for technical abilities. |
Features of the behavior of subjects that are repeated many times during testing, i.e., appear at the level of a trend, are additional qualitative indicators of the test. Qualitative indicators not only additionally characterize the level of development of analytical-synthetic abilities and non-verbal (visual-effective) intelligence, but also reflect individual characteristics cognitive activity, personal characteristics and methods of emotional response, individual psychopathological symptoms.
| Observable signs of the subject's behavior | Interpretation |
| Features of cognitive activity | |
| Can't cope with solving even the first most simple tasks | Violations of practical, visual and effective thinking |
| Unable to solve the problem even after showing it the right way solutions or when repeating tasks | Visual and motor memory impairments, extremely low learning ability |
| Too often refers to the sample, looks at the cubes | Visual memory impairments, reduced level of development of visual-figurative thinking |
| Solve problems using significant muscle effort; tension, tremors, awkward movements | Motility disorders, organic disorders of the central nervous system |
| Says his actions out loud, comments on the decision | Involvement of verbal functions, difficulties in performing practical actions |
| Has difficulty understanding instructions and does not use hints | Violations verbal intelligence, insufficient language acquisition |
| Doesn't notice or correct errors | Disorders of perception, attention, voluntary control |
| Works very unevenly: performs some tasks quickly and correctly, others slowly or with errors | Impaired performance, fatigue |
| Features of personality and emotional state | |
| Folds patterns carelessly, easily gives up decisions | Lack of interest |
| Reacts easily to minor stimuli, gets distracted | Emotional lability, inconstancy, instability of activity, attention disorders |
| Tenaciously strives to find the right solution, focused on the task | Planfulness, purposefulness, stability of activity |
| Quickly begins to fold the image, is in a hurry, acts by trial and error, which he immediately corrects | Impulsiveness |
| Thinks before starting to fold a pattern, initially draws up a plan for the solution, pre-lays out the cubes in a certain order | Tendency to reflect, prudence, organization, pedantry |
| Easily changes ways to solve a problem, tries different variants | Plasticity, flexibility |
| Persistently tries to solve a problem in the same way, has difficulty giving up an ineffective solution | Intellectual rigidity |
| Talks loudly, is in constant motion, waves his arms | State of overexcitement |
| Solve problems silently, inactive | Lethargy |
| Criticizes tasks, destroys the pattern when it fails | Reacting aggressively when faced with challenges |
| Hesitates when choosing a solution, makes excuses | Anxiety, fear, desire to avoid failure, lack of self-confidence |
| Rejoices, laughs, does not lose heart when failures occur | Elevated mood |
| Criticizes himself, does not express joy at success | Tendency to react depressively |
| Talks a lot with the experimenter, asks questions, shares experiences | Desire for contacts |
| Silent, does not answer questions | Distancing, avoiding communication |
| Indicates, demands | Domination |
| Asks for help, looks for tips, advises | Addiction |
Literature
1. Kohs S. S. Intelligence measurement. A psychological and statistical study based upon the block design test. -- New York: McMilan, 1927.
2. Agafonova I. N., Kolechenko A. K., Pogorelova G. A., Shekhovtseva L. F. Methods for studying intelligence: Methodological recommendations. --Part 1. - St. Petersburg: St. Petersburg GIUU, 1991.
3. Anastasi A. Psychological testing: Per. from English / Ed. Gurevich K.M., Lubovsky V.I. - Book. 1. - M.: Pedagogy, 1982.
4. Arbuzov V. N. Kos tests. //Soviet psychotechnics. -T. VII. - 1934, No. 1. -WITH. 48-60.
5. Wine A, Simon T. Methods for measuring mental giftedness: Sat. articles. -- Kharkov: State. ed. Ukraine, 1923.
6. Bleikher V. M., Burlachuk L. F. Psychological diagnostics of intelligence and personality. - Kyiv: graduate School, 1978.
7. Burlachuk L. F. Psychodiagnostics of personality. - Kyiv: Health, 1989.
8. BurlachukL. F., Morozov S. M. Dictionary-reference book on psychological diagnostics. - Kyiv: Naukova Dumka, 1989.
9. GaidaV. K., Zakharov V.P. Psychological testing: Textbook. - L.: Leningrad State University, 1982.
10. GilyashevaI. N, Practical use adapted intelligence test in the clinic of neuropsychiatric diseases: Methodological recommendations. - L.: B.I., 1987.
11. Glass J., Stanley J. Statistical methods in pedagogy and psychology: Transl. from English / Under general, ed. Adler Yu. P. - M.: Progress, 1976.
12. Eliseev O. P. Constructive typology and psychodiagnostics of personality. - Pskov: POIUU, 1994.
13. Using the “Kosa Cubes” technique for professional diagnostic purposes: Methodological recommendations for specialists in employment and career guidance services. / Compiled by: Smirnova A.V., Khakhunova M.N. - Yaroslavl: Yaroslavl city center
vocational guidance and psychological support for the population, 1995.
14. Kashin A.P. Diagnostic scaling of psychophysiological functions. //Theoretical and applied research on the psychophysiology of individual differences. - Kazan: KSU, 1973.- P. 4-16.
15. Kulagin B, V. Fundamentals of professional psychodiagnostics. -L.: Medicine, 1984. 16. Panasyuk A. Yu. Adapted version of D. Weksler™ra’s technique. - M.: Research Institute of Psychiatry of the Ministry of Health of the RSFSR, 1973.
17. Panasyuk A, /O. Structural-level analysis of the dynamics of intellectual development of mentally retarded and healthy children: Abstract of thesis. diss. pump uch. Art. Ph.D. psychol. Sci. - L., 1976.
18. Psychodiagnostic methods (in a complex longitudinal study of students). - L.: Leningrad State University, 1976.
19. Psychological Dictionary / Ed. Davydova V.V., Zaporozhets A.V., Lomova B.F., etc. - M.: Pedagogy, 1983.
20. Serebryakova R. O. Application of a standardized set of methods for studying intellectual activity to solve diagnostic problems in some neuropsychiatric diseases: Abstract of thesis. diss, nasoisk. uch. Art. Ph.D. psychol. Sci.


APPENDIX 2.
Example of interpretation of results
FORM FOR RECORDING RESULTS
FULL NAME. I. Sergey Nikolaevich date 23.04.2000
Age (years) 49
Education higher Profession mechanical engineer additional information traumatic brain injury
Total points 24 Standard score (stan) 5
State of the art nonverbal intelligence: Average
Carrying out during testing: Often refers to a model, says his actions out loud, does not notice his mistakes, is easily distracted
CONCLUSION
Despite average level productivity of visual-effective thinking, the subject has difficulty in solving practical problems due to attention disorders and lack of voluntary control. With sufficient preservation of the functions of spatial analysis and synthesis, visual perception and motor coordination, it may not be able to cope with complex constructive activities that require long-term concentration of attention, verification and comparison of results. Problems are possible when performing technical activities, as well as in the process of learning and solving complex intellectual problems.
student of 11 “B” class Baigunakov Azat.
Urban testing
| Items | October 18 | November 22 | 21 December |
| Kazakh language | 11 | 12 | 13 |
| Russian language | 7 | 9 | 8 |
| Mathematics | 4 | 7 | 6 |
| History of Kazakhstan | 6 | 8 | 7 |
| The World History | 6 | 6 | 7 |
| Sum | 34 | 42 | 41 |
| Without Kazakh language | 23 | 30 | 28 |
School testing
| Items | September 21 | 15th of November | November 30th | December 14 | January 17 |
| Kazakh language | 5 | 13 | 13 | 17 | 11 |
| Russian language | 7 | 9 | 5 | 9 | 7 |
| Mathematics | 5 | 6 | 3 | 11 | 4 |
| History of Kazakhstan | 7 | 20 | 6 | 5 | 6 |
| The World History | 4 | 7 | 6 | 3 | 8 |
| Sum | 28 | 55 | 33 | 45 | 36 |
| Without Kazakh language | 23 | 42 | 20 | 28 | 25 |

The results of city tests in all subjects correspond to the “satisfactory” rating. In total with points in the Kazakh language overall result below the passage. Among the “sinking” topics, most of the sections school curriculum. Largest quantity gains points in the Kazakh language. Very low results in mathematics and world history
School test results also show large gaps in knowledge. At the same time, these results objectively reflect the student’s level of preparation and correspond to the results of the current and intermediate certification. Baigunakov A. studied in all subjects of the school curriculum throughout the entire course of study with a basic grade of “satisfactory”.
____________________________A has become familiar with the analysis. Baigunakov
Analysis of results trial testing
student of 11 “B” class Alexander Bohunenko.
Urban testing
| Items | October 18 | November 22 | 21 December |
| Kazakh language | 17 | 18 | 19 |
| Russian language | 19 | 21 | 19 |
| Mathematics | 11 | 12 | 14 |
| History of Kazakhstan | 8 | 12 | 13 |
| Physics | 15 | 8 | 14 |
| Sum | 70 | 71 | 79 |
| Without Kazakh language | 63 | 53 | 60 |

School testing
| Items | September 21 | 15th of November | November 30th | December 14 | January 17 |
| Kazakh language | 4 | 16 | 21 | 16 | 18 |
| Russian language | 18 | 18 | 20 | 20 | 19 |
| Mathematics | 10 | 14 | 13 | 15 | 15 |
| History of Kazakhstan | 13 | 13 | 13 | 14 | 10 |
| Physics | 11 | 11 | 12 | 14 | 15 |
| Sum | 56 | 72 | 79 | 79 | 77 |
| Without Kazakh language | 52 | 56 | 58 | 63 | 59 |

The results of city physics tests are unstable: the result on November 22, 2013 is almost two times lower than the previous one. There is a positive trend in results in the Kazakh language. A consistently high score in the Russian language, while “satisfactory” grades in subjects such as physics and mathematics do not correspond to current grades and grades for the quarter.
The results of school testing are characterized by positive dynamics of results in physics, a consistently high score in the Russian language, higher
kimi, in comparison with city testing, results in mathematics, a large difference in results in the Kazakh language. Preparation on the history of Kazakhstan requires special attention. The total scores for all trial tests are higher than the passing score.
Based on the results of all testing, subject teachers carried out an element-by-element analysis with the obligatory identification of “losing” topics and the development of recommendations for eliminating gaps.
____________________________A has become familiar with the analysis. Bohunenko
Analysis of trial test results
student 11 “B” Burchitsa Bogdana.
Urban testing
| Items | October 18 | November 22 | 21 December |
| Kazakh language | 8 | 15 | 12 |
| Russian language | 14 | 13 | 15 |
| Mathematics | 7 | 10 | 6 |
| History of Kazakhstan | 18 | 18 | 17 |
| Geography Sun. ist | 17 | 14 | 15 |
| Sum | 64 | 70 | 65 |
| Without Kazakh language | 56 | 55 | 53 |

School testing
| Items | September 21 | 15th of November | November 30th | December 14 | January 17 |
| Kazakh language | 16 | 12 | 18 | 15 | 18 |
| Russian language | 13 | 14 | 10 | 13 | 17 |
| Mathematics | 12 | 6 | 7 | 7 | 8 |
| History of Kazakhstan | 10 | 14 | 16 | 15 | 16 |
| Geography Sun. ist | 12 | 9 | 14 | 20 | 16 |
| Sum | 63 | 55 | 65 | 70 | 75 |
| Without Kazakh language | 47 | 43 | 47 | 55 | 57 |

City test results are generally higher than school results. In all city tests, the total score is higher than the passing score. In three out of five school tests, the total score without taking into account the results in the Kazakh language is below fifty. The results of tests in the Kazakh language, which took place at the school, correspond to the “good” rating, the lowest results are in mathematics, which corresponds to the results of the current and intermediate certification (the student has one “C” in algebra for six months). It is necessary to strengthen the work on preparing for tests in the Russian language, because they are unstable and the corresponding grades are lower than the student’s current performance.
Based on the results of all testing, subject teachers carried out an element-by-element analysis with the obligatory identification of “losing” topics and the development of recommendations for eliminating gaps.
I am familiar with the analysis ____________________________B. Burczyc
Analysis of trial test results
student 11 "B" Kabakova Anastasia.
Urban testing
| Items | October 18 | November 22 | 21 December |
| Kazakh language | 17 | 17 | 16 |
| Russian language | 18 | 11 | 11 |
| Mathematics | 5 | 6 | 8 |
| History of Kazakhstan | 7 | 7 | 10 |
| Biology | 10 | 19 | 11 |
| Sum | 57 | 60 | 56 |
| Without Kazakh language | 40 | 43 | 40 |
Analysis of the results of trial testing of gymnasium No. 1
2011-2012 academic year
On October 6, 2011, the third trial testing was conducted at the gymnasium, the purpose of which is to adapt students to the UNT, their awareness of testing technology, control the quality of knowledge and preparation for the UNT.
Testing of students was carried out according to the tests of the National State Center for Technical Education of the KEU, the results are as follows
A total of 45 graduates (out of 49), i.e., 93% of students, took part in the testing.
4 students scored 100 or more points
The results show that compared to the previous testing, the average score is 2.8 points lower. Students sat alone, bags and cell phones were put away on the last desk, testing conditions were close to UNT conditions. Based on the preliminary results, low results can be expected this year, so it is necessary to intensify preparation for the UNT and use various forms and methods of work.
Monitoring test results
The chart shows that the results are unstable, lower than last year, but there has been an increase in results over several tests this year.
The results compared to 1 test are slightly higher.
Math scores have improved.
By general history 4 students take it. results are lower than last year. The lowest quality knowledge is in physics and mathematics. Didn't do well in biology on this test.
The contender for Altyn Belgi confirmed all the A's for the first time.
Monitoring testing of applicants for the certificate with honors and Altyn Belgi.
Surname | Russian language p | Story | Mathematics | kaz yaz with rus language | Total | ||||||||
Surname | Russian | Story | Mathematics | kaz yaz with rus language | subject of choice | Total |
|||||||
name prev |
|||||||||||||
Davletshina | |||||||||||||
Abdrakhmetova | |||||||||||||
Kuketaeva | |||||||||||||
Ukubaeva | |||||||||||||
From the results it is clear that only one has a 4, the rest of the applicants have threes. It is necessary to organize individual work with excellent students to prepare for the UNT.
So far no one has confirmed all A's, poor results in biology, history, and mathematics.
1. The lowest results in physics, mathematics and history of Kazakhstan, the highest in English. language, Kazakh language There are no twos. In that academic year 4 applicants for the certificate with distinction and 1 applicant Altyn Belgi scored all A's only
2. Comparative testing results show instability; it is recommended that all teachers prepare monitoring of individual results on trial testing.
3. Subject teachers should draw up plans for working with low-achieving and excellent students.
4. Class teachers hold parent-teacher meetings on Saturdays and invite parents of students who do not meet the threshold level for admission to universities.
based on the results of analysis of the results of trial diagnostic testing in Unified State Exam format in mathematics, Russian language and elective subjects
In accordance with the preparation plan for the state (final) certification of 11th grade graduates, approved by order of the Gymnasium No. 353 dated September 20, 2012. and order No. 406 dated October 20, 2012. “On conducting trial diagnostic testing in the Unified State Exam format for 11th grade graduates” in order to prepare 11th grade graduates for passing the state final certification, practicing skills in working with Unified State Exam forms, working with tests, 11th grade students took part in diagnostic testing in Russian language, mathematics and elective subjects.
Staffing
| № | Item | Teacher's name | Category |
| Mathematics | Safonova L.G. | 1st quarter category |
|
| Russian language | Ziyatdinova A.I. | highest qualification category |
|
| Physics | Gilmanova N.N. | 1st quarter category |
|
| Social science | Kuzyukova O.V. | highest qualification category |
|
| Computer science | Salakhieva E.M. | 1st quarter category |
|
| Story | Karametdinova R.F. | 1st quarter category |
|
| English language | Ismagilova G.I., Shamseeva A.D. | 1st quarter category |
|
| Biology | Kropacheva L.L. | highest qualification category |
|
| Chemistry | Yuskaeva Ch.M. | 1st quarter category |
Thus, qualified teachers work in the parallel 11th grade.
In the parallel 11th grade in the 2012/2013 academic year, 45 graduates are studying in two classes. A total of 40 students (89% of the total) took part in the diagnostic testing.
41 out of 45 11th grade students took part in diagnostic testing in the Russian language (this is 91% of the total). Amirova R., Badertdinova L., Yakubova A., Bilyalov A. did not take part.
The results of the trial Unified State Examination in the Russian language are presented in the table:
| Class | Russian language (minimum – 36) |
||||||
| below min. level | Satisfied. level | Good. level | Excellent level | Academic performance, % | Quality, % | Average score |
|
| 0-35 | 36-63 | 64-79 | 80-100 |
||||
| 11A | 0 | 12 | 3 | 2 | 100 | 29 | 63,9 |
| 11B | 0 | 6 | 11 | 7 | 100 | 75 | 72,8 |
| total | 0 | 18 | 14 | 9 | 100 | 56 | 69,1 |
Thus, the test performance in the Russian language is 100%, the quality is 56%. The average test test score in the Russian language is 69.1 points: in 11A - 63.8 points, in 11B - 72.8 points. Let me remind you that according to the contract assignment, the average score in the Russian language must be at least 72 points. As you can see, the task was not completed.
In the 2012/2013 academic year, for the first time in the practice of a unified state exam, by order of Rosobrnadzor dated August 29, 2012 No. 3499-10 established minimal amount points for all Unified State Exam subjects, confirming that exam participants have mastered the basic general education programs secondary (full) general education in accordance with the requirements of the federal government educational standard secondary (complete) general education. In the Russian language, the minimum number of points is 36 points. In our trial testing, all 11th grade graduates completed the work with scores above the threshold. The lowest number of points was scored by 3 students of class 11A: Fassakhova A., 11A - 52b., Galiullin B., 11A - 52b., Khalimova A., 11A - 53b.
9 graduates completed the work, scoring above 80 points, but the highest results were from V. Plaksin, 11b – 95b., T. Gulyaeva, 11b – 95b., Yu. Nechaeva, 11b – 90b., D. Sitdikov, 11b – 90b.
Comparative results with the results of diagnostic testing in the Russian language, written by the same students in the last academic year, are shown in the diagram. Last year, 97% of students were able to complete the work satisfactorily. This year – 100%. It is understandable that last year the guys were not ready to do the work at the time of completing the work; many topics were not studied. But the quality of work, unfortunately, remains at the same level.
Comparative results are also presented for classes separately. It shows that in the humanities class the quality of work is lower than last year. Although this subject in this class is studied in profile level.
The analysis of errors showed that in the Russian language students made mistakes on tasks related to text analysis, punctuation marks, combined and separate spelling of words, determining methods of word formation, choosing linguistic means of expression, determining types complex sentence. When completing assignment Part C, due to inattentive reading of the text, we were unable to correctly formulate and comment on the problem and select arguments.
36 out of 45 students took part in diagnostic testing in mathematics (this is 80% of the total number). Did not take part: Badertdinova L., Farkhutdinova I., Yakubova A., Bilyalov A., Kiyko D., Nechaeva Y., Sklyarov A., Sklyarova V.
The results of the trial testing in mathematics are presented in the table:
| Class | Mathematics (minimum – 24) |
||||||
| below min. level | Satisfied. level | Good. level | Excellent level | Academic performance, % | Quality, % | Average score |
|
| 0-23 | 24-46 | 47-64 | 65-100 |
||||
| 11A | 1 | 10 | 5 | 0 | 94 | 33 | 37,8 |
| 11B | 0 | 7 | 9 | 4 | 100 | 65 | 52 |
| total | 1 | 17 | 14 | 4 | 97 | 53 | 45,6 |
Thus, the test performance in mathematics is 97%, the quality is 53%. The average test test score in mathematics is 45.6 points: in 11A - 37.8 points, in 11B - 52 points. Let me remind you that according to the contract assignment, the average score in the Russian language must be at least 57 points. As you can see, the task was not completed.
According to mathematics, the minimum number of points is set at 24 points. In trial testing, 1 graduate of class 11A did not overcome the threshold value: Vakhitova V., 11A – 20b. 1 graduate of class 11A Khalimova A. scored exactly 24 points, i.e. her performance is on the verge of “2”. Only 4 graduates performed at an excellent level, of which only one scored above 80 points: Plaksin V., 11B – 81b.
Comparative results with the results of diagnostic testing in mathematics, written by the same students in the previous school year, are shown in the diagram. Last year, 76% of students were able to complete work above the threshold. This year – 97%. It is understandable that last year the guys were not ready to do the work at the time of completing the work; many topics were not studied. But the results might have been different if all test participants had taken part in the testing (I don’t presume to judge whether it’s better or worse).
Comparative results are also presented for classes separately. This shows that in the humanities class the performance of work has increased.
The analysis of errors showed that in mathematics, students made mistakes on tasks: derivative and investigation of a function, transformation of expressions, problems on planimetry and stereometry, solving word problems. In the tasks of part C:
Only 35% coped with the decision trigonometric equations and systems of equations. The main drawback in completing this task was that the task was solved completely correctly, but the answer was indicated incorrectly;
43% completed task C3 – solving inequalities;
19% completed geometry tasks;
100% failed to complete the task with parameters, and only two tried to solve it (Sitdikov D., Plaksin V.);
Task C6 was also completed only by D. Sitdikov and V. Plaksin.
Trial diagnostic tests were conducted for 11th grade students in elective subjects. To pass the Unified State Exam in subjects of their choice, students chose the following subjects: physics - 15 people (33% of the total number of 11th grade graduates), social studies - 20 people (44%), history - 11 people (24%), English – 10 people (22%), literature – 8 people (18%), chemistry – 9 people (20%), biology – 8 students (18%), computer science – 9 students (20%).
11 graduates chose only one elective subject, 25 graduates - 2 subjects and 9 graduates - 3 subjects.
Data on the number of people who took part in trial testing are presented in the table:
| item | Number of people who chose this item for State Examination | Number of people who took part in diagnostic testing | % of those who took part in diagnostic testing | FI of absentees |
| physics | 15 | 14 | 93% | Kiiko D. |
| social science | 20 | 17 | 85% | Badertdinova L., Farkhutdinova I., Yakubova A. |
| story | 11 | 8 | 73% | Ivanova K., Senkina E., Tsaturyan R. |
| English language | 10 | 10 | 100% | |
| literature | 6 | 5 | 83% | Amirova R. |
| chemistry | 9 | 8 | 89% | Bilyalov A. |
| biology | 8 | 3 | 37% | Bilyalov A., Nechaeva Yu., Sklyarov A., Sklyarova V. |
The choice of specialized subjects and corresponding specialized classes was also analyzed. In the social and humanities class, 15 students choose social studies, which is more than half, and history - 6 students. In a physics and mathematics class, half the class—12 students—choose physics. The choice of subjects indicates the implementation of the profile chosen by the students. There are students in the classes who have not chosen any of the core subjects, with the exception of compulsory subjects. In 11A this is Safina I. (she chooses biology, chemistry) and Gainutdinov D. (he chooses physics). In 11B these are Govorukhina I., Tsybulya K. (they choose social studies, history, English), Ivanova K. (history, English, literature), Ignatieva A., Kaimakov M. (they choose social studies), Senkina E. ( history, English), Tsaturyan R. (social studies, history).
The results of the trial testing are presented in the tables:
| Class | Physics (minimum – 36) |
||||||
| Below is the minimum. level | Satisfied. level | Good. level | Excellent level | Academic performance, % | Quality, % | Average score |
|
| 0-35 | 36-52 | 53-67 | 68-100 |
||||
| 11A (3) | 1 | 2 | 0 | 0 | 67 | 0 | 38,7 |
| 11B (12) | 0 | 3 | 6 | 2 | 100 | 73 | 57,7 |
| Total | 1 | 5 | 6 | 2 | 93 | 62 | 53,6 |
Kiiko D., a student in grade 11B, did not take part in the testing.
The success rate of diagnostic testing in physics is 93%, quality is 62%. The average test score is 53.6.
According to the order of Rosobrnadzor dated August 29, 2012 No. 3499-10 in physics, the minimum number of points is set at 36 points. In the trial testing, 1 graduate of class 11A did not overcome the threshold value: Khalimova A., 11A – 30b. 1 graduate of class 11A Ibragimova A. scored exactly 36 points, the work is very weak, i.e. her performance is on the verge of “2”. Moreover, Albina Ibragimova chooses this item “just in case.” Just like Gazetdinov Albert in 2011 chose computer science “just in case,” and accordingly completed the work with a “2”. 2 graduates completed the work at an excellent level and scored above 80 points: Sitdikov D., 11B - 81b., Plaksin V., 11B - 86b.
| Class | Social studies (minimum – 39) |
||||||
| Below is the minimum. level | Satisfied. level | Good. level | Excellent level | Academic performance, % | Quality, % | Average score |
|
| 0-38 | 39-54 | 55-66 | 67-100 |
||||
| 11A (15) | 0 | 7 | 5 | 0 | 100 | 42 | 52,8 |
| 11B (5) | 1 | 1 | 3 | 0 | 80 | 75 | 55,6 |
| Total | 1 | 8 | 8 | 0 | 94 | 50 | 53,6 |
Badertdinova L., Farkhutdinova I., Yakubova A., students of grade 11A, did not take part in the testing.
The success rate of diagnostic testing in social studies is 94%, quality is 50%. The average test test score is 53.6 points.
According to the order of Rosobrnadzor dated August 29, 2012 No. 3499-10, the minimum number of points in social studies is 39 points. In the trial testing, 1 graduate of grade 11B did not overcome the threshold value: Kaymakov M. – 37b. Vakhitova V., a student of grade 11A, scored exactly 39 points.
The analysis of errors showed that social studies students made mistakes on tasks related to economics (factors of production, reference to social realities and graphic information). Difficulties are caused in defining terms and concepts. In the tasks of part C, difficulties were encountered in listing features, phenomena, using concepts in a given text, and revealing theoretical positions using examples.
The teacher also noted the peculiarity of the work in that the children coped with tasks of increased difficulty, but made mistakes in tasks at the basic level.
| Class | History (minimum – 32) |
||||||
| Below is the minimum. level | Satisfied. level | Good. level | Excellent level | Academic performance, % | Quality, % | Average score |
|
| 0-31 | 32-49 | 50-67 | 68-100 |
||||
| 11A (6) | 0 | 4 | 1 | 1 | 100 | 33 | 50,3 |
| 11B (5) | 0 | 0 | 1 | 1 | 100 | 100 | 66 |
| Total | 0 | 4 | 2 | 2 | 100 | 50 | 54,3 |
Ivanova K., Senkina E., Tsaturyan R., students of grade 11B did not take part in the testing.
The success rate of diagnostic testing in history is 100%, quality is 50%. The average test test score is 54.3 points.
According to the order of Rosobrnadzor dated August 29, 2012 No. 3499-10 in history, the minimum number of points is set at 32 points. Ibragimova A., a student of grade 11A, scored the lowest number of points - 37 points. As a result, Albina is not in physics, not in history passing the Unified State Exam not prepared. Two students wrote work at an excellent level, but no one completed the work above 80 points. Most maximum score among history test participants – 69 points (Saifullina A., Tsybulya K.).
Analysis of errors showed that history students made mistakes in tasks to establish the chronological sequence of events. All test participants experienced difficulties in working with various sources of information. In the tasks of part C there were difficulties in the ability to formulate own position on the issues under discussion, use historical information for argumentation, present the results of historical and educational activities in free form.
| Class | English language (minimum – 20) |
||||||
| Below is the minimum. level | Satisfied. level | Good. level | Excellent level | Academic performance, % | Quality, % | Average score |
|
| 0-19 | 20-58 | 59-83 | 84-100 |
||||
| 11A (6) | 0 | 2 | 3 | 1 | 100 | 67 | 66,2 |
| 11B (4) | 0 | 0 | 1 | 3 | 100 | 100 | 88 |
| Total | 0 | 2 | 4 | 4 | 100 | 80 | 74,9 |
100% of graduates who chose this subject took part in the testing.
Diagnostic testing performance English language is 100%, quality is 80%. The average test score is 74.9 points.
According to the order of Rosobrnadzor dated August 29, 2012 No. 3499-10, the minimum number of points in English is 20 points. Vakhitova V., a student of class 11A, scored the lowest number of points – 48b. 4 students wrote their work at an excellent level, three of them scored high scores: Govorukhina I., 11B – 97b., Senkina E., 11B – 93b., Ivanova K., 11B – 92b. Farkhutdinova I., grade 11A completed the work with 85 points.
All mistakes made are due to inattentive reading of the text, lack of knowledge of the vocabulary found in the text. Difficulties arose in understanding the text listened to.
| Class | Literature (minimum – 32) |
||||||
| Below is the minimum. level | Satisfied. level | Good. level | Excellent level | Academic performance, % | Quality, % | Average score |
|
| 0-31 | 32-54 | 55-66 | 67-100 |
||||
| 11A (5) | 0 | 1 | 1 | 2 | 100 | 75 | 62 |
| 11B (1) | 0 | 0 | 1 | 0 | 100 | 100 | 60 |
| Total | 0 | 1 | 2 | 2 | 100 | 80 | 61,6 |
Amirova R. did not take part in testing.
The success rate of diagnostic testing according to the literature is 100%, the quality is 80%. The average test test score is 61.6 points.
According to the order of Rosobrnadzor dated August 29, 2012 No. 3499-10, the minimum number of points for literature is 32 points. Bagautdinov A., a student of class 11A, scored the lowest number of points – 43b. 2 students wrote work at an excellent level, but not higher than 80 points: Zateeva N., 11A - 73b., Saifullina A., 11A - 73b.
Mistakes were made in determining the means of expression lyrical work. In the tasks of part C, they were unable to provide the necessary arguments.
| Class | Chemistry (minimum – 36) |
||||||
| Below is the minimum. level | Satisfied. level | Good. level | Excellent level | Academic performance, % | Quality, % | Average score |
|
| 0-35 | 36-55 | 56-72 | 73-100 |
||||
| 11A (1) | 0 | 1 | 0 | 0 | 100 | 0 | 47 |
| 11B (8) | 0 | 5 | 2 | 0 | 100 | 28,5 | 52,6 |
| Total | 0 | 6 | 2 | 0 | 100 | 25 | 51,9 |
Bilyalov A., Gulyaeva T. did not take part in testing.
The pass rate of diagnostic testing in chemistry is 100%, quality is 25% (lowest quality). The average test score is 51.9 points.
According to the order of Rosobrnadzor dated August 29, 2012 No. 3499-10 in chemistry, the minimum number of points is set at 36 points. Almost all test participants wrote at a weak satisfactory level. There were mistakes made on many assignments from the chemistry course. We did not start solving many problems because the material will be studied in the 11th grade course
| Class | Biology (minimum – 36) |
||||||
| Below is the minimum. level | Satisfied. level | Good. level | Excellent level | Academic performance, % | Quality, % | Average score |
|
| 0-35 | 36-54 | 55-71 | 72-100 |
||||
| 11A (1) | 0 | 0 | 1 | 0 | 100 | 100 | 68 |
| 11B (7) | 0 | 0 | 1 | 1 | 100 | 100 | 67 |
| Total | 0 | 0 | 2 | 1 | 100 | 100 | 67,5 |
Only 4 out of 8 students took part in testing in this subject (A. Bilyalov, Yu. Nechaeva, A. Sklyarov, V. Sklyarova did not participate).
The success rate and quality of diagnostic testing in biology is 100%. The average test test score is 67.5 points.
According to the order of Rosobrnadzor dated August 29, 2012 No. 3499-10 in biology, the minimum number of points is set at 36 points. Test participants made mistakes on topics of grades 8-9, i.e. These questions were not repeated by the boys.
In computer science, school trial testing was not carried out, since the day before, according to the order of the Ministry of Education and Science of the Republic of Tatarstan, all schools of the republic, including us, participated in the experiment conducting the Unified State Exam in computer science in computerized form. On October 23, 26 and 30, 27 11th grade graduates, including those who chose computer science, wrote the K-USE. The results were summarized in a specially installed program and sent to the IMC. The test results have not yet been reported.
Based on the results of the trial Unified State Examination, a ranking of graduates was compiled based on the total score and average Unified State Exam score.
12 graduates have a score above 220 points (since prestigious universities require a passing score of at least 220 points): Govorukhina I., Sayfullina A., Tsybulya K., Ivanova K., Gulyaeva T., Salikova S., Khodzhakhanov B., Zateeva N., Plaksin V., Butakova K., Rafikova L., Sitdikov D., Sadykova A., Khasanshina G.
2 graduates have an average score on all Unified State Examinations above 80: Plaksin V. - 87.3b., Sitdikov D. - 83.3b.
12 graduates have an average score for all Unified State Exams below 50. The lowest average score is for two graduates: Vakhitova V. - 40.8b., Khalimova A. - 37.8b.
For questions about filling out forms Unified State Exam graduates The 11th graders approached it more responsibly than the 9th graders. Some participants did not have their passport details written down on the form or did not sign in the appropriate box. I ask subject teachers of both grades 9 and 11 to draw students’ attention to the design of the letter “C” in the forms. Unclear or incorrect writing of any letters will result in the student not receiving their marks, which will affect the final result.
Based on the above, CONCLUSIONS and RECOMMENDATIONS:
All subject teachers should take control of the issue of preparing students for the Unified State Exam, develop a plan to eliminate gaps in knowledge, work more often on test tasks with filling out answers in special forms through classwork and extracurricular activities.
Prepare graduates for diagnostic work through the StatGrad system (December 12 – in Russian, December 18 – in mathematics).
Prepare graduates to conduct paid diagnostic work in the city (December 19 - in Russian for grades 9, 11, December 20 - in mathematics for grades 9, 11).
Class teachers Shamseeva A.D., Ziyatdinova A.I. bring the results of trial tests to the attention of parents of 11th grade students parent meeting November 26, 2012
Krasnoperova A.R., Deputy Director for SD, class teachers Shamseeva A.D., Ziyatdinova A.I. conduct individual conversations with students and their parents who failed the test in subjects.
The certificate was read out at a meeting with the director on November 19, 2012.
The article discusses computer testing as one of the methods for testing students' knowledge. The advantages and disadvantages of testing were analyzed and developed guidelines for teachers on using it in the educational process. The role of computer testing is shown as effective method quality control of student training. The results of monitoring students' knowledge were assessed, taking into account the complexity of the tests, and criteria for assessing test results were determined; the causes of the most common errors in test tasks have been identified; types test tasks, causing the greatest difficulties for test takers. The effectiveness of test methods depends on the focus of the test, the correct layout of the types of test tasks and the structure of the process. Usage computer technology in the practice of pedagogical testing, it allows not only to significantly facilitate the interpretation process, to apply a unified approach to the formation of test tasks and evaluation of test results, but also to accurately identify the level of preparedness of the test taker. Today, testing is considered as a modern paradigm for objective assessment of students' educational achievements, which is associated with the widespread use of computers and their didactic capabilities in the knowledge control system.
test tasks
information and communication technologies
educational process
test designer
validity
representativeness
computer testing
1. Shevchenko S.M., Tyumina N.S. Trends innovative development general education / S.M. Shevchenko, N.S. Tyumina // Integration information technologies into the system vocational training. Collection of articles based on materials from the regional scientific-practical conference. – Nizhny Novgorod: NSPU im. K. Minina, 2016. – pp. 50-52.
2. Kadnevsky V.M. Genesis of testing in the history of domestic education / V.M. Kadnevsky. – Omsk: Omsk State University, 2011. – 335 p.
3. Tyumina N.S., Shevchenko S.M. Information means of computer testing / N.S. Tyumina, S.M. Shevchenko // Integration of information technologies into the system of professional and additional education collection of articles based on materials from the regional scientific and practical conference. – Nizhny Novgorod: NSPU im. K. Minina, 2016. – pp. 174-177.
4. Efremova N.F. Test control in education: tutorial for students receiving education in pedagogical directions and specialties / N.F. Efremova. – M.: Logos, 2014. – 368 p.
5. Zvonnikov V.I. Measurements and quality of education / V.I. Zvonnikov. – M.: Logos, 2006. – 73 p.
6. Shevchenko S.M., Tyumina N.S. Computer testing in the educational process / S.M. Shevchenko, N.S. Tyumin // Materials of regional scientific-practical work. conference "Integration of information technologies into the system of additional and vocational education" – Nizhny Novgorod: NSPU im. K. Minina, 2017. – pp. 55-58.
7. Chaikina Zh.V. Modern means of assessing learning outcomes: teaching aid/ Zh.V. Chaikina. – Nizhny Novgorod: NSPU im. K. Minina. – N. Novgorod, 2014. – 48 p.
8. Ovchinnikov V.V. Assessing students' educational achievements during testing / V.V. Ovchinnikov. – M.: Testing Center MORF, 2011. – 27 p.
9. Simonenko V.D. Program “Technology. 7th grade. Federal State Educational Standard" [ Electronic resource]. – URL: http://rusacademedu.ru (date of access: 01/25/2017).
10. Simonenko V.D., Samorodsky P.S. Technology. 7th grade / ed. V.D. Simonenko. – M.: Ventana-Graf, 2014. – 153 p.
In the Modernization Concept Russian education the task of creating an independent quality assessment system educational process is considered as one of the most important modern education. TO important elements The education quality system includes monitoring of student performance results, which should be carried out at all levels and stages of the educational process. The problem of choosing a method for studying the level of training of students, the quality of the formed knowledge, skills and abilities is important for general secondary education.
A certain contribution to the solution of this problem was made in due time by Francis Galton, who created the test as a tool for monitoring learning results, E. Thorndike and R.D. Fischer. According to modern requirements, the level of educational results of students, determined for each academic subject in accordance with educational programs and Federal State Educational Standards. One of modern methods assessment of the level of training of students is testing.
Testing as a method of control makes it possible to assess the quality of students’ training, standardize the measurement methodology and interpret the results. Testing can be organized both for students to work with a printed test and with a computer. Using modern means programming, you can develop fairly universal computer tests multi-purpose. This form of control allows you to use various types of visibility, take into account the individual characteristics of those being tested, and automate the processing of the received data. The problem of computer testing is the choice of tools and programs for developing test items.
The advantages of this method include: the manufacturability of the study, the ability to store and compare control results, as well as identify the causes of gaps in training. Testing can perform different functions depending on the stage of the lesson. For example, when updating knowledge to correctly solve a test task, students may need previously studied material, thus testing makes it possible to identify “gaps” in knowledge. Test methods allow you to highlight the main thing in the topic under consideration, to draw students’ attention to important theoretical aspects during the process of primary consolidation of the material. Testing involves the implementation of both independent and collective forms of work, discussion of the most difficult tasks, and promotes the activation of self-control and reflection of students at various stages of the lesson.
Test methods play important role in optimization educational process with multi-level preparation of the class, implementation of broad and deep control over the development of knowledge by students. On the one hand, they help solve the problem of individualizing tasks depending on the student’s level of mastery of the material being studied. On the other hand, the use of information technology makes it possible to automate calculations, organize the study of new material using educational games and programs, which, in turn, contributes to the development of cognitive interest among students, develops their information culture, and introduces modern approaches solving problem situations in the classroom.
The undoubted advantages of test methods are: objectivity of the resulting assessment, “equality” of students in the control process, coverage of a significant volume educational material during testing, comparative ease of interpretation of test results, saving time on testing knowledge. The use of computer testing in the educational process helps to generalize educational material, identify cause-and-effect relationships, update previously studied topics, and develop logical thinking when solving non-standard test tasks.
Disadvantages of testing include: the length and complexity of test development; the need for confidentiality to ensure the objectivity of test results; the possibility of a high probability of “guessing” the correct answers; the need to eliminate incorrect tasks after each testing.
The development of tests, in our opinion, involves the fulfillment of the following requirements: significance; scientific credibility; representativeness (presence of the main structural elements content of the subject in the volume necessary for control); increasing complexity of educational material; variability depending on the content of the material being studied and the volume of hours; consistency of content; validity; complexity and balance of the test; relationship between content and form.
The paper presents the results of an experiment to evaluate the effectiveness of using computer testing in technology classes. The experiment was carried out on the basis of MBOU “School No. 190” in Nizhny Novgorod with 7th grade students.
Testing of the developed test tasks in the study was carried out in technology lessons in grade 7 “A” - experimental group, and grade 7 “B” - control group. Students of grade 7 “A” underwent computer testing, and in case of an error in answering a specific question, they had the opportunity to answer a similar question again. In grade 7 “B”, students were given a blank test that required only one answer attempt. Testing was carried out on the topic “Technologies for manual processing of metals and artificial materials”, the total number of test takers was 24 boys (12 people in each group), the number of test tasks j = 20. Visual Studio was used to create tests. The work determined the “average” achievement of a group of subjects (G), which allows us to evaluate the effectiveness of testing as a means of monitoring knowledge and the validity of the test. The validity of test tasks is characterized by the following indicators:
Frequency of execution of the jth task (number of correct answers to the jth task);
The share of correct answers, proportional to the number of test takers;
Number of incorrect answers for the jth task;
Difficulty index, which is determined by the formula:
![]() , (2)
, (2)
where is the number of people tested,
j - number of test tasks (j=20),
i - number of test takers,
Primary score of subjects (gives a grade for the test passed).
It should be noted that during computer testing, if the answer is correct on the first try, then try again.
The “average” achievement of the group of subjects (G) was determined by the formula:
Analysis of the results obtained (Figures 1-3) allows us to draw the following conclusions:
The test is valid since the difficulty index of the test tasks lies in the range ![]() ;
;
They have a task difficulty index ranging from 0.3 to 0.4, which indicates the literacy of the test;
The percentage of guessing ranges from 0.14 to 0.25;
The effectiveness of testing as a means of monitoring technology knowledge, determined by formula (3):
![]()
![]()
The data obtained show that with an equal number of test takers (12 students), the “average” achievement of class 7 “A” is higher than that of the control group 7 “B”. Firstly, this is due to the possibility of using a second answer attempt during computer testing. Secondly, with computer testing, students better understand the instructions and the meaning of the question in matching tasks, which make up 30% of the test. Thirdly, despite the fact that the test effectiveness indicator lies in the range from 12 to 16 correctly solved tasks (Figure 1), a significant part of the students received a grade of “3”. The number of students who received grades of “4” and “5” in computer and form testing is approximately the same.

Rice. 1. Comparative analysis assessments of students in the experimental and control groups based on technology testing results
Analysis of the matrix of responses from test takers of both groups made it possible to identify the tasks that caused the greatest difficulties for students:
Alternative answer (reproduction) tasks aimed at identifying reasoning skills;
Multiple choice tasks ( self-study), aimed at testing knowledge of the classification of turning tools and their purpose;
Tasks to establish compliance (independent study), aimed at testing the level of knowledge of professions related to metal processing, the ability to correlate elements of machine tools, hand-held cutting tools, technological operations with their names;
Multiple choice tasks (using knowledge when performing non-standard tasks), aimed at identifying the ability to interpret the studied material and mastery of the skills of relating the elements of a cutting tool and their letter designation.
The main factors influencing the quality of test tasks on the topic “Technologies for manual processing of metals and artificial materials” are:
Reduced level of independence of students when working with textbooks, in particular, such as;
Insufficient number of textbooks of the same sample, which complicates preparation for testing;
Inability of students to interpret the studied material in accordance with the test question;
Lack of skills to correlate technological elements and concepts with their names and designations.
The tasks in the tests were levels I, II and III (level I - tasks on reproducing knowledge; level II - on applying knowledge in a non-standard situation; level III - tasks on independently mastered material). It should be noted that students had difficulties with tasks of difficulty levels I and II (Figure 2), which confirms the above reasons for the most common errors when performing test tasks. Analysis of the test results of class 7 “A” showed that with the same number of subjects, the total number of errors made was 84 (I - 29, II - 30, III - 25), while in class 7 “B” - 97 (I - 35, II - 35, III - 27). This is due to the fact that during computer testing, students had the opportunity to answer a similar question again, while blank testing is characterized by inattentive reading by students of the instructions for completing test tasks and, as a consequence, errors in answering.

Rice. 2. Distribution of test tasks by difficulty level
The largest number of errors were made when completing test tasks for addition (Figure 3), which indicates obvious difficulties in applying the acquired knowledge.
During computer testing open questions caused fewer difficulties than with blank control, despite the fact that the probability of error in the first case is much higher. This is due to the fact that in the program the answer is given in specific form and any difference from it in the student’s answer (change in ending, spelling error, etc.) leads to the fact that the answer is not counted. The difficulty index of test items of class 7 "A" can be characterized as evenly distributed, in contrast to the results of class 7 "B".
The main mistake students made during the form testing was the incorrect allocation of time to complete tasks.

Fig.3. Distribution of test tasks by difficulty index
As a rule, subjects first answered questions that did not raise doubts in them, and then proceeded to the remaining test tasks, trying to answer them, using general erudition and intuition, or simply trying to guess the answer. This indicates that students are not always confident in their knowledge, skills and abilities acquired in training sessions.
Testing on the topic “Technologies for manual processing of metals and artificial materials” can be considered effective, since it made it possible to identify the level of knowledge of students and the causes of errors when they performed test tasks.
Carrying out a qualitative analysis of test tasks involves following the following recommendations:
Preliminary study of the psychological and pedagogical characteristics of the group of test takers;
Guiding the rule: than larger number tested, the more reliable the interpretation results;
Analysis of educational material for testing, taking into account the pace of development of educational material by students;
Construction of test tasks of different levels of complexity;
Elimination of incorrect tasks after each testing of the test, increasing its representativeness.
It must be taken into account that the test results may be slightly influenced by factors such as the environment (light, weather, noise, temperature), the emotional and physical state of the test takers, and others. Below are the features of computer testing as a means of monitoring students’ knowledge:
1) ensuring the objectivity of the assessment of educational achievements;
2) implementation of automated statistical processing of student achievements;
3) the ability to test a large amount of information and the level of proficiency of each subject;
4) a more accurate rating scale, consisting of 20 divisions (questions) in contrast to the usual one, consisting of four;
5) ensuring equal conditions for all students through the use of a single procedure and assessment criteria, which reduces psycho-emotional stress.
Thus, the test as a tool for testing students’ knowledge, the main tasks of which is control and generalization of the studied material, is effective in organizing the educational process. However, it should be noted that when solving other problems, for example, creative problems or project activities, it is necessary to combine tests with other methods of monitoring students’ assimilation of educational material, since they do not always allow a full assessment of students’ skills and abilities. In conclusion, it should be noted that the development of testing programs adapted to the personal characteristics of the subjects, so-called non-traditional tests, is possible only with the use of information technology.
Bibliographic link
Pachurin G.V., Tyumina N.S., Shevchenko S.M. ANALYSIS OF TESTING AS A MEANS OF CONTROL OF STUDENTS’ KNOWLEDGE // Contemporary issues science and education. – 2017. – No. 4.;URL: http://science-education.ru/ru/article/view?id=26716 (access date: 02/01/2020). We bring to your attention magazines published by the publishing house "Academy of Natural Sciences"